

What is the link between GB electricity and gas prices?

Political debate is a game of soundbites for both politicians and media commentators. In turn, those soundbites tend to rely heavily on recent traumas which stand out in the mental maps of politicians, commentators and their assumed audience. In the case of energy policy, the trauma that dominates the views of politicians and commentators in the UK is the disruption to the European gas market after the Russian invasion of Ukraine and the sanctions imposed by the EU on imports of gas from Russia and its impact on domestic electricity prices.
As an illustration of this trauma Ofgem displays two graphs on its website showing weekly forward prices for gas and electricity from early 2021 to the current date. It uses these prices in setting price caps for domestic consumers of gas and electricity. The lesson that we are expected to take from these graphs is the simultaneous spikes in both gas and electricity prices from the middle to the end of 2022. Little attention is paid to how these prices have moved – either together or separately – since the beginning of 2023 and even less to market behaviour before 2022.
All thinking is dominated by an extreme, although relatively brief, episode of market breakdown following the imposition of limits on Russian pipeline supplies of natural gas from the European market. Since 2023 these supplies have largely been replaced by LNG imports from the US and the Middle East. This has led to an increase in the general level of European gas prices from an average of $6.72 per million BTU (mmbtu) for June 2017 to May 2019 to $11.72 per mmbtu for June 2023 to May 2025.[1]
For the current UK government, the trauma of 2022 is offered as the primary justification for heavy investment in solar and wind generation under its Clean Power 2030 plan. The Secretary of State for Energy Security and Net Zero argues that the government’s policies will reduce reliance upon gas generation and, thus, insulate the GB electricity market from shocks in European gas prices. This reflects the conventional wisdom that gas generation is consistently the marginal source of generation in the GB market and, thus, determines market prices. Cutting the number of hours in each month or year for which gas generation is required will limit or even eliminate the link between gas prices and electricity prices. I will refer to this as the DESNZ doctrine.
Unfortunately, it is far from clear that the conventional wisdom is correct, at least in the terms that it is usually expressed. If there is one country in Europe which satisfies the Secretary of State’s goal of energy independence it is France with its large fleet of nuclear plants supported by substantial hydro capacity. If the availability of large amount of low carbon generation capacity can secure the kind of insulation from the influence of gas prices on market electricity prices, this ought to be visible in market data for France.
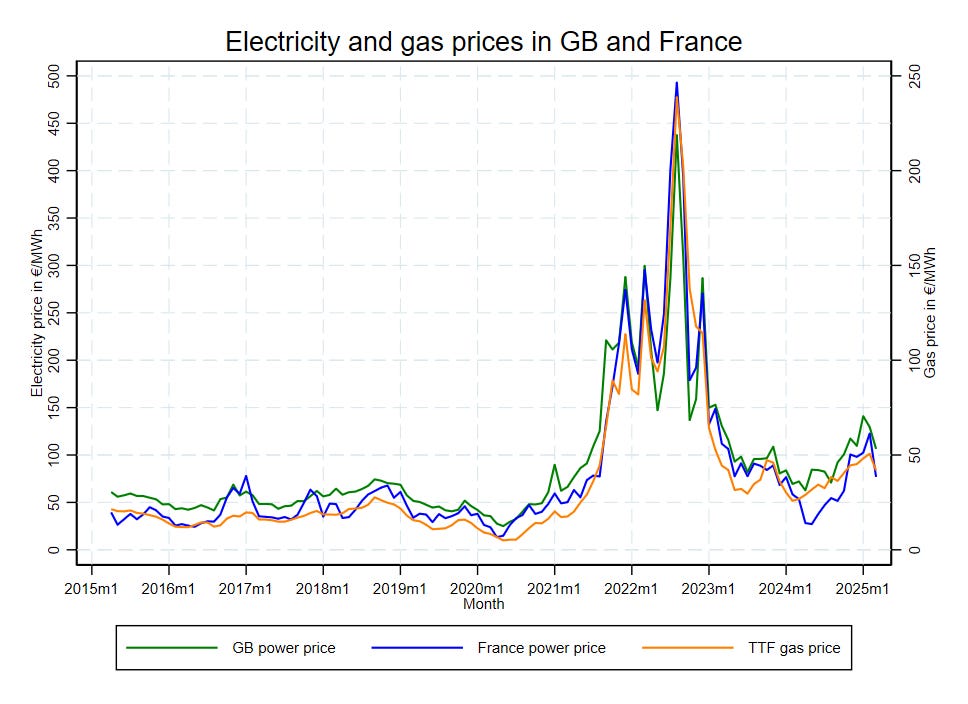
The figure above plots the wholesale electricity prices in Great Britain and France with the TTF gas price (all in € per MWh) monthly over the 10 years from April 2015 to March 2025.[2] In the aggregate terms that politicians and Ofgem use, there would seem to be no substantial difference between the impact of gas prices on power prices in GB and France, notwithstanding the large difference between the two countries in their reliance on gas generation.
On this comparative evidence, the assertion that increasing the contribution of low carbon generation in the generation mix will protect households from spikes in gas prices is patently wrong. In statistical terms the correlation between monthly electricity prices in the GB and French markets is 0.96, which is very high. The correlations between the electricity prices in GB and France and the TTF gas price were 0.94 and 0.97 respectively.[3]
As everyone is taught, correlation does not signify causation, especially when multiple variables vary synchronously. To probe in more depth the figure below shows the evolution of (a) the share of imports of electricity in total GB electricity demand, and (b) ratio of the average market price of electricity in €/MWh to the average gas price in €/MWh. The higher the share of imports in total demand, the more important will be European electricity prices as a factor influencing GB electricity prices. On the other hand, the higher the ratio of electricity to gas prices the more that relatively old and inefficient gas plants will operate to meet GB demand.
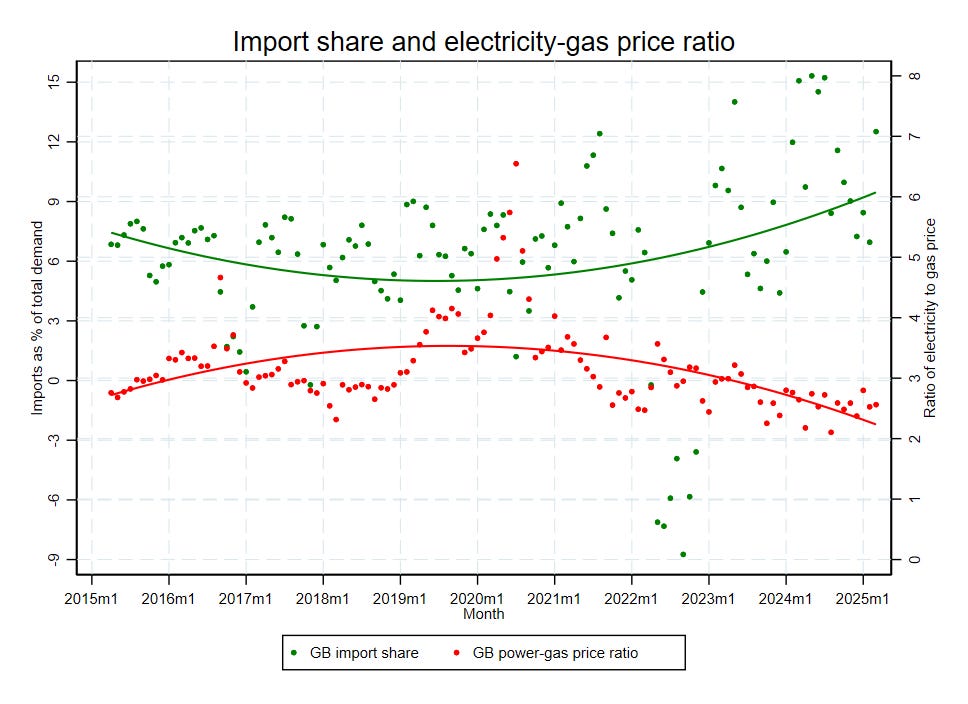
The two indicators reflect different aspects of the critical trade-off that determines GB market prices. To meet increases in demand do we rely upon generation from older gas plants or upon imports of electricity over the increasing number of interconnectors to Western Europe. The DESNZ doctrine essentially relies on the idea that imports have little or no influence on domestic market prices. Instead, market prices are set by variations in how much gas generation is utilised.
The fitted trend lines in the graph suggest that up to late 2019 variations in imports were becoming less important as an influence on market prices, while variations in gas generation were becoming more important. That gives some support to the DESNZ doctrine. However, since late 2019 those trends have reversed with a significant increase in the contribution of imports, largely because of the completion of interconnectors to Belgium (NEMO), France (IFA2 and ElecLink), Denmark (Viking) and Norway (NSL) between 2019 and 2023. The inference from this analysis is that the DESNZ doctrine is out-of-date and imports have begun to play a more important role in determining GB electricity prices.
As is obvious, there is a lot of month-to-month variation in both indicators, which is why I have focused on the fitted trend lines. However, there is one episode shown in the data that requires further comment as it corresponds to the timing of the spike in gas prices in 2022-23. On average the GB market is a net importer of electricity, but between April and November 2022 the GB market became a significant net exporter of electricity to Western Europe. Could this have been related to the spike in European gas prices?
Probably not. As a matter of very bad luck, EDF had to shut down a series of French nuclear plants for emergency repairs, starting in February-March 2022 and lasting into 2023. These outages resulted in a substantial reduction in French nuclear generation. While cynics might argue that this supply shock was rather convenient, in reality EDF lost a huge amount of revenue because of the shutdowns. For the year from April 2022 to March 2023 French nuclear output was more than 25% below expected output based on average monthly output for the decade excluding 2022-2023.
Hence, the spike in electricity prices in 2022-23 was not just the consequence of the gas price shock following the Russian invasion of Ukraine. Indeed, the TTF gas price rose from an average of $6.52 per mmbtu in the period from January to March 2021 to $38 per mmbtu in December 2021. While the TTF gas price peaked at about $70 per mmbtu in August 2022, the peak was very brief. The TTF gas price in December 2022 was actually lower ($36 per mmbtu) than its price a year earlier and the average TTF gas price for 2022 was about $40 per mmbtu.
What made the episode so painful for European electricity customers was the simultaneous reduction in French nuclear generation. As I have explained in previous articles, in normal circumstances France is the swing producer of electricity in Europe and exports not only to the GB market but also to Belgium, Germany, Switzerland, Italy and Spain. Of these countries, Belgium, Switzerland, Italy and Spain rely quite heavily on gas generation to meet variations in demand.
The loss of up to one-third of French nuclear output in some months was as much - perhaps even more – of a shock to European electricity markets as the progressive loss of Russian gas supplies. However, because it was not so visible to policymakers and the public in the UK, the trauma of the rapid increase in market electricity prices in 2022 is associated with exposure to European gas prices.
The figure below shows the trends for import dependence and electricity-gas price ratios if observations for April 2022 to March 2023 are excluded. This is the period when the French nuclear shock was at its worst. The fitted curves are similar to those in the previous graph but the increase in import dependence from 2019 on is more marked, with a trend value of nearly 11% in March 2025 and a period in 2024 when monthly imports averaged 15% of total demand.

But, what about the very high correlation between gas prices and GB market prices? Doesn’t this support the DESNZ doctrine? Sadly this is an illustration of the kind of statistics denounced by Darrell Huff in his classic book How to Lie with Statistics. The very high correlation between GB market electricity prices and gas prices is obtained by calculating the correlation between monthly averages of electricity and gas prices. Suppose we were to do something different by calculating the correlations between daily average electricity price and daily gas prices for each year from 2015 to 2024.
The graph below shows the results of those calculations. The yearly correlation coefficients between GB electricity prices and GB gas prices (the green solid line) vary over a wide range from less than 0.5 to more than 0.9 over 10 years. The correlations between GB electricity prices and the European TTF gas prices (the orange solid line) follow the same pattern but tend to be rather lower. The most consistent and high correlations are between GB daily electricity prices and daily electricity prices in France and Germany (the blue and purple dashed lines) since 2021.
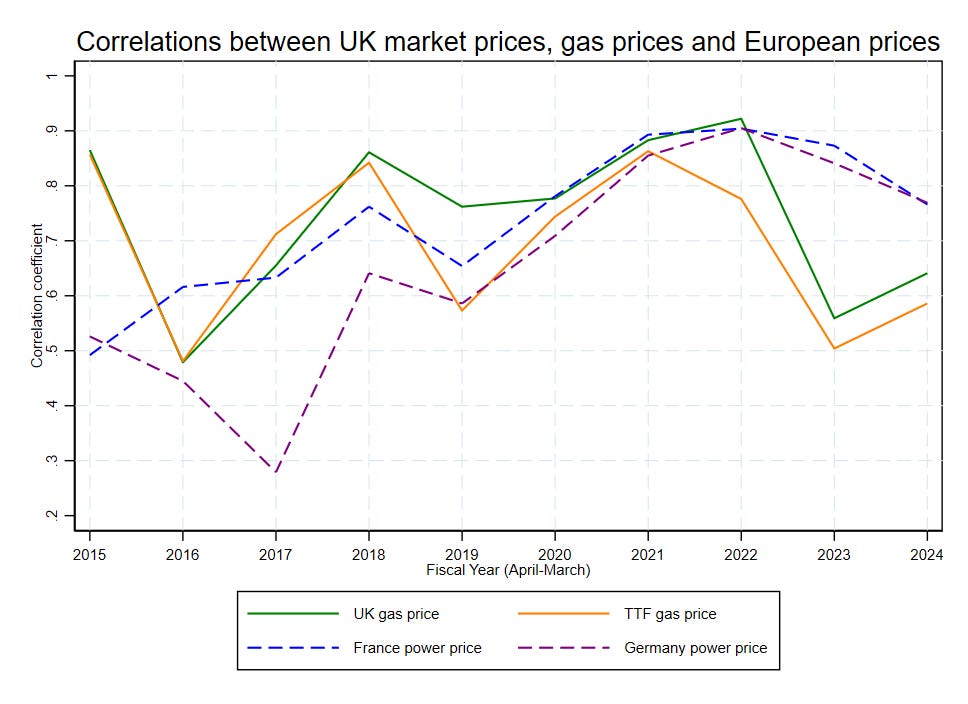
The lesson is to beware of relying too much on correlations that are a product of the way in which data is calculated and presented. The very high correlation between monthly electricity and gas prices were a consequence of (a) using monthly averages which suppress the large amount of daily variation, and (b) including the period from 2021 to 2022 when both electricity and gas prices spiked, albeit for reasons that were more complicated than the DESNZ doctrine claims.
We should avoid moving from one absurdity to another. I do not wish to claim that variations in GB gas prices have no impact on market electricity prices. What we should learn from this analysis is that electricity markets are more complex than the DESNZ doctrine implies. In particular, during the last 5 years the balance of factors influencing GB electricity has shifted away from gas prices to a much greater influence of European electricity prices as a consequence of the increasing dependence on imports of electricity, especially from France.
Doctrines, especially outdated doctrines, have important consequences. Rather than reducing the GB’s market’s exposure to external supply shocks, the policies implemented on the basis of the DESNZ doctrine will actually worsen the UK’s exposure to such shocks by increasing reliance on imports from Europe.
[1] Data for the TTF reference gas price from the World Bank’s Commodity Price Databank. The periods are chosen to omit the effects of both the Covid-19 pandemic and the cut-off Russian gas supplies between early-2020 and end-2022. European gas prices used to be much lower than import prices for LNG to Japan. Now the two are similar: Japanese LNG import prices are about $1 per mmbtu higher than European import prices but they are more stable.
[2] The GB electricity price is the N2EX day-ahead hourly market price reported by Nordpool, while the French and German electricity prices are the EEX day-ahead hourly market prices reported by ENTSO-E. The monthly average prices are unweighted averages of the hourly prices. The TTF gas price is the daily spot price for over-the-counter trades reported by ICE.
[3] While the TTF gas price is used as the standard reference price for European gas, there are divergences between the GB system average gas price (SAP) set at what is called the National Balancing Point (NBP) and the TTF price which is set in the Netherlands. The correlation between the GB electricity and the SAP gas price is 0.98. The correlation between the SAP and TTF prices is extremely high – over 0.995 – if the period of market disruption caused by French nuclear outages is excluded.
Prices for renewables are fixed CFD or FIT contract prices, the only generators that get the market price are gas fired generators. It should not come as a surprise that market prices for electricity correlate with the price of gas
Its still strikes me as odd that we import so much from Europe given the usage charges for the i/c are upwards of E10/MWhr. I can understand it from France given its low cost of production and big nuclear plants up on the Channel seems reasonable and even Norway albeit their exports create a problem on pricing in South Norway but the other countries?
The other thing not made clear is day ahead pricing is c60-70% of volume the remainder either comes from forward contracts or in day adjustments. OK its the dominant element but not the full picture.