Oil price hysteria

The events of the last two weeks have led to an outbreak of oil price hysteria. The mainstream media from the BBC to many newspapers hyperventilate that the spot price of oil has reached or exceeded $100 per barrel (bbl). The Economist even managed to title the main leader in its March 14th edition as “An attack on the world economy” with the sub-heading “Whatever happens in the Strait of Hormuz, energy markets have been changed for ever”.
Much of this reporting appears to be fed by market traders for whom volatility is their major source of profit. However, the reporters should have access to a Bloomberg terminal that can provide graphs of oil prices over the last 5, 10 or 25 years. Even without such support there are a myriad of online sources that will provide similar data and graphs. Last of all, it is not hard to access the historical data compiled by the Energy Information Agency of the US government.
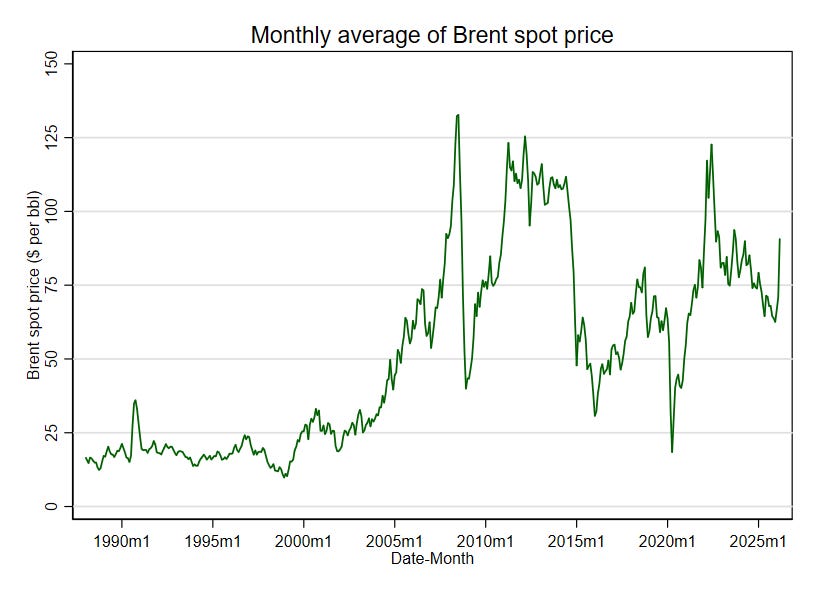
So, let us start with the bare facts.[1] The graph above shows monthly averages for the Brent spot price of crude oil back to 1988 in current prices. This price exceeded $100 for 6 months in 2008, 42 months from 2011 to 2014, and 6 months in 2022. Over the last 20 years the monthly average Brent spot price has exceeded $100 for 23% of all months. This is hardly a rare occurrence, though it is not routine.
The abrupt increase due to the Iran war and the closure of the Strait of Hormuz may have come as a surprise because the average oil price has tended to fall since 2022. Still, no-one should be too surprised. Historically, the oil price has been enormously volatile. The standard deviation (a measure of the variability of monthly prices) over the last 20 years has been $23 with a mean of $77. In simple terms, what that means is we should expect large variations from month to month in the monthly average oil price. Over several years those fluctuations tend to average out, but the time taken to revert to the mean may be lengthy.[2]
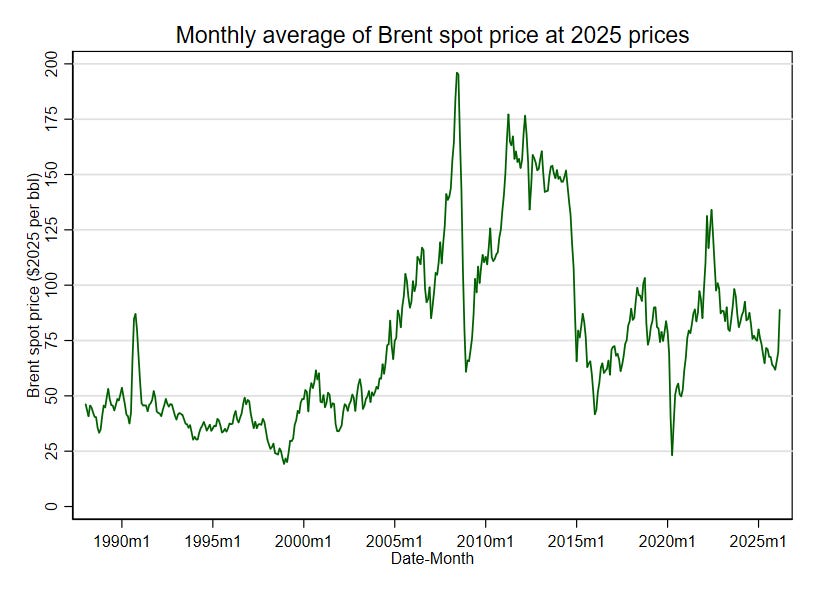
In addition, comparing the current spot prices of oil over a long period is quite misleading, since it ignores the impact of general inflation. The second graph above shows the monthly averages of Brent spot prices adjusted to 2025 prices.[3] In this case, the monthly average price exceeded $100 at 2025 prices at least once in every year from 2005 to 2014 as well as in 2018 and 2022. Indeed, the average monthly price over the whole period from 2005 to 2025 was $101 at 2025 prices.
The immediate lesson that can be drawn from these graphs is that most journalists, including market specialists, have no memory. It is plainly idiotic for the editorial board of The Economist to claim that there has been some fundamental change in the energy market. All that has happened is a reversion to what we might call the status quo ante, i.e. to the state of the oil market during the decade from 2005 to 2014. True, the average oil price has been about $78 at 2025 price since 2015, but no one with historical knowledge of the oil market could be confident that was a stable pattern. Indeed, large increases in 2018 and again in 2022 showed that the average masked large annual variations.
For the UK there is another story that lies behind both trends in and the volatility of oil prices. Over the period from 1980 to 2025 the total capacity of oil refineries in the UK has fallen from about 2.7 million barrels per day to 0.9 million barrels per day – a decline of 66%. No new refineries have been commissioned in the UK since 1969, and none are ever likely to be built in future.
As a result, the UK relies upon a combination of four major refineries – at Milford Haven (Pembrokeshire), Killingholme (Lincolnshire), Fawley (Hampshire) and Ellesmere Port (Cheshire) – plus imports. Each refinery is optimised for different types of crude oil and produces different combinations of petroleum products. The decline in North Sea oil production was an important factor in the closure of some refineries. In addition, the operators of the remaining refineries have warned that the ETS, discussed in an earlier article, has undermined the financial viability of all refineries in the UK.
The four major refineries were commissioned in roughly their modern form between 1950 and 1969. All are over 50 years old, though they have been repeatedly modified since being commissioned. Oil refining is a capital-intensive and risky business. The four refineries are at the minimum economic scale for the business – 10 to 15 million tonnes per year. As a reference, there are refineries in India (Jamnagar), South Korea (Ulsan and Yeosu), and the UAE (Ruwais), whose capacities are similar to or greater than the total capacity of the four large UK refineries.
The critical feature of UK refining for oil prices is that UK demand for petroleum products has switched away from light fractions (petrol and similar products) towards middle distillates (diesel, kerosene and gasoil). Consequently, the UK has a large surplus of petrol – net exports are about 30% of total production – and a large deficit of middle distillates – net imports of diesel, kerosene and gasoil account for more than 50% of its total consumption.
Refineries can change the composition of their output. Usually this requires large investment and may be constrained by environmental regulations.[4] Operators will be reluctant to make major changes if they are not confident that they will be able to earn an adequate risk-adjusted return on the investments required.
Under present policies, the UK’s major refineries are operating in run-off mode. The owners minimise new investment and extract what cashflow they can generate with the expectation that the refineries will cease to operate when they can no longer cover their operating costs. Naturally, in public the owners may deny such a harsh assessment, but the steady contraction of UK refining over the last two decades tells its own story. Complaints about the burden of ETS payments are just one reflection of the precarious finances of UK refineries.
The imbalance in the UK’s refining mix is illustrated by the gap between UK market diesel and petrol prices excluding duty and VAT. In 2025 the average market price for diesel was $138 per bbl vs $123 per bbl for petrol. In 1990 that relation was reversed with average market prices of $102 for diesel and $123 for petrol at 2025 prices.
The 1990 relationship corresponds to what would be expected if the refining mix matched the demand mix. However, average market prices for diesel have exceeded those for petrol in the UK since 1995. The increase of $36 per bbl in the average market price of diesel relative to that of petrol represents the cost of moving to rough balance in the refining mix to a combination of large imports for diesel and large exports for petrol. From 1990 to 2025 the annual average spot price of Brent crude increased from $58 per bbl to $69 per bbl at 2025 prices.
This increase of $11 per bbl is much less than the change in the margin between the market prices of refined products. How many commentators or policymakers understand that the impact of policies on oil refining has had a far larger impact of the cost of petroleum products in the long run than what happens in the world oil market? As always, it is easy to show striking visual images of oil tankers and traders shouting on commodity exchanges rather than focusing on the larger forces that determine what we pay for transport and heating.
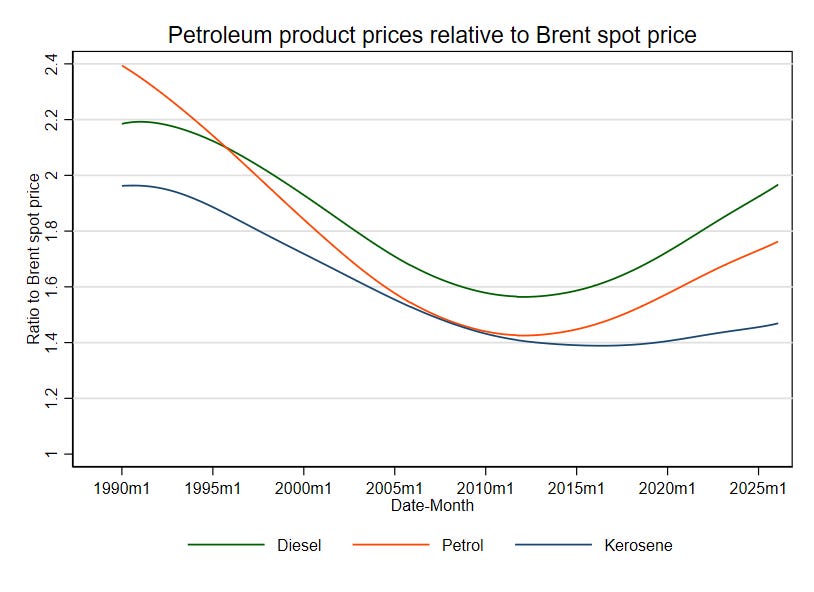
The graph above summarises the trends in the relationship between UK petroleum product prices and the Brent spot price.[5][6] A ratio of 1.0 means that the average product price is equal to the average crude price. We should expect the ratio to exceed 1.0 except in periods of market disruption because of refining, transport and other costs. What stands out is the U-shaped decline in ratios for all three products from 1990 to 2010-12 followed by the steady increase for diesel and petrol since 2012.
The change reflects the gradual shift in the direction of the UK’s trade in petroleum products. In 2012 total exports of products by volume exceeded total imports by 3 million tonnes. By 2024 the balance had shifted completely with total imports exceeding total exports by 13 million tonnes. The contraction of production at and later closure of Coryton, Milford Haven, Lindsey and Grangemouth refineries between 2012 and 2025 was the major factor accounting for that major shift in the balance of trade.
The increase in the margins for refining, transport and other costs since 2010-12 represent an increase of about 25% in the market prices of diesel and petrol holding crude spot prices constant. This change was hidden by the period of relatively low spot prices from 2015 to 2020, but the effect has become more obvious since then, and especially with the price spikes in 2022 and 2026.
The people who write media articles about complicated industries like oil and gas are too often lazy and ill-informed. Indeed, it is true that the spot price of oil has gone above $100 per barrel, but so what? That has happened many times in the past, especially after we adjust for inflation.
For daily life in the next year or five years, the impact of refinery closures on the prices that we pay for petroleum products has been and will be much more significant. How many people understand and can explain that? It is part of the mostly untold story of how the decline in North Sea oil and gas production as well as in downstream activities has substantially affected economic activity and employment in the UK. That is neither fashionable nor acceptable to discuss when achieving Net Zero is the priority. Of course, the Norwegians are not quite so stupid as the London blob!
[
1] The spot price data in the graphs is taken from the Energy Information Agency while UK prices for petroleum product are retail prices excluding duty and VAT published as Tables 4.1.1 to 4.1.3 of the Quarterly Energy Prices dataset.
[2] The median standard error of the annual means over 20 years is close to $2, which is only 3% of the average price.
[3] I have used the US quarterly GDP deflator in making the adjustment to 2025 prices.
[4] Existing operations are “grandfathered”, i.e. covered by the environmental regulations in force when the refinery was last modified, while any significant changes may require that the whole plant must comply with stricter environmental standards. This is often a major barrier to upgrading refineries after major new environmental rules have been introduced, which is what happened in the EU during the 2010s.
[5] The lines use what is known as the “lowess” method of smoothing to highlight trends rather than monthly or yearly variations.
[6] For those not familiar with different petroleum products, kerosene or regular heating oil is the fuel used in almost all domestic oil heating systems. Technically it is 28-sec gasoil, which is less viscous and cleaner-burning than the 35-sec gasoil used for agricultural and industrial machinery.
Retired accountant Paul Homewood managed to find great oil and gas price graphs for this post: https://www.conservativewoman.co.uk/the-climate-scaremongers-eds-mad-objection-to-north-sea-gas/, graphs from https://tradingeconomics.com/commodity/brent-crude-oil.
I suspect the main reason the captive MSM (here and in the USA) is making such a song and dance about the price of oil and gas is that they are desperate for President Trump to fail.
I’m a little confused by the third graph. Can you explain if the price of products is pre or post tax and whether the comparison is mass or volume basis? European wholesale products markets are typically quoted in mass basis but crude and customer level prices ante both volumetric.