Looking under the wrong lamp post
The costs of electricity systems, not technologies

I have been busy completing several studies of electricity systems that will be published before the end of the year. I will post articles based on those studies when they appear. To set the scene, this post is the text of a lecture that I gave in September 2021 to a conference organized by the Institution of Mechanical Engineers and the Institute of Physics. It hasn’t been published elsewhere, but I believe that the argument remains relevant to the evolution of the electricity system in the UK (and elsewhere). In particular, it highlights trends in the relationship between wholesale and retail prices that have continued since 2020. There is tendency among commentators to get excited about developments that are new and often temporary. That is misleading. It is important to recognize that complex systems such as electricity markets tend to change gradually rather than dramatically. The talk preceded the impact of Russia’s invasion of Ukraine on European energy markets, but in retrospect the events of 2022 should be seen as an excursion from trends that were clearly under way during 2021.
In this lecture I will argue that many analysts and commentators who focus on the electricity sector have a strong tendency to look under the wrong lamp post by concentrating on generating technologies while neglecting the fundamental change in the composition of electricity costs and revenues that has occurred over the last two decades. There are strong reasons to believe that this direction of change will continue and, indeed, get stronger over the next two decades. The consequence is that the issues that must be addressed by policymakers and managers are likely to very different from the assumptions that underpin most discussions today.
The timing of this lecture is fortuitous because the topic of electricity prices and costs is headline news but with the unfortunate result that politicians and journalists are, as all too often, proposing short term fixes that will not solve the structural problems that have emerged and are likely to get worse. The proximate cause of the current headlines is a squeeze in the global natural gas market of a kind that occurs roughly every 4-6 years, partly in reaction to low prices due to the pandemic last year and partly because of the combination of a cold winter and the recovery of economic activity. The UK effectively decided 4 years to rely on LNG at the margin in place of domestic production and storage, so it has become more dependent on supplies from the global gas market. The consequence of higher volatility in gas prices and the impacts on the main consuming sectors was both predictable and predicted. The only point worth noting is that policymakers and regulators, as usual, ignored any analyses that they found inconvenient and failed to prepare for the inevitable knock-on effects of market volatility.
Figure 1 - The composition of domestic electricity prices, 2005-2020 [£ per MWh at 2018 prices]
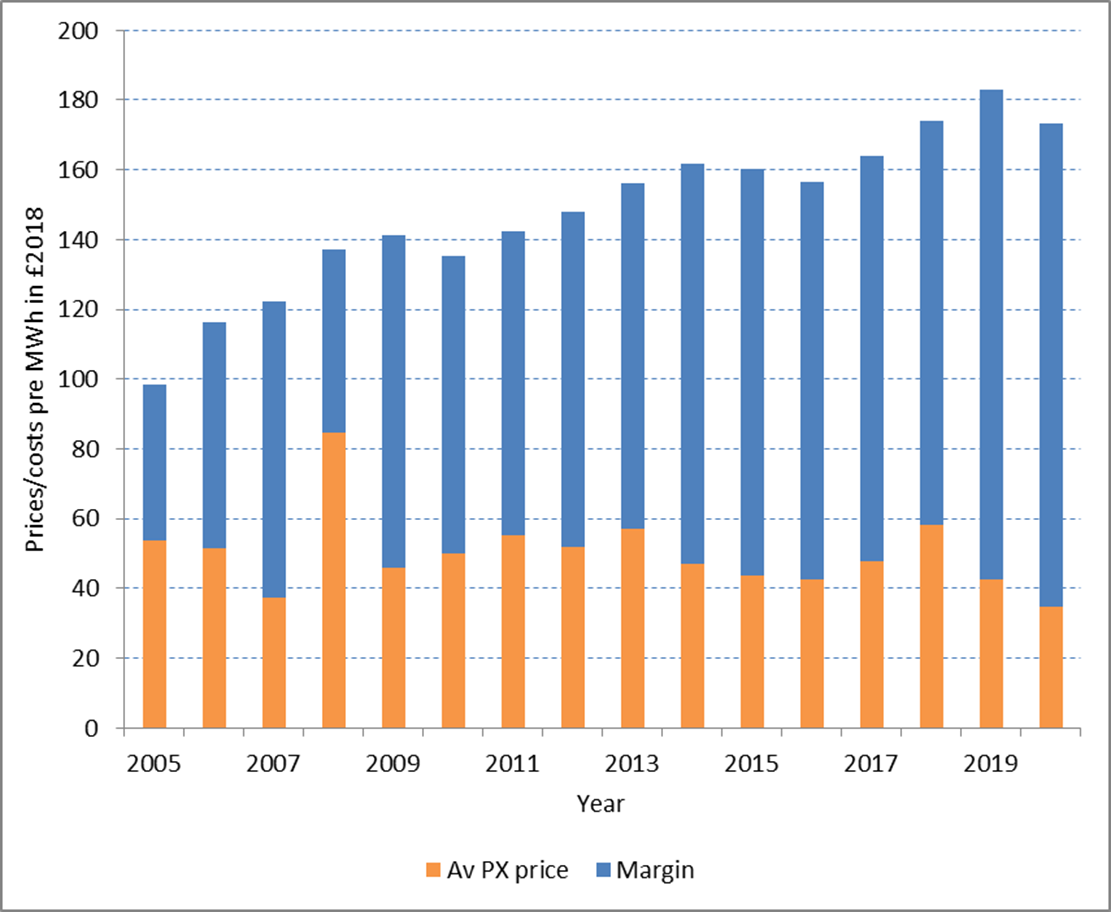
The political salience of recent events in the gas and electricity markets is highlighted in the first two of my figures. Figure 1 shows the division between generation costs (measured by market or Power Exchange prices) and system costs of average domestic prices in real terms excluding VAT. In this context I use the term ‘system costs’ to refer to the margin between the user price and the market prices, so it includes network charges and supply costs as well as a variety of mandatory levies that are paid by either networks or suppliers. This measure is an underestimate of true system costs because a portion of network charges are paid by generators.
The real price fell significantly from 1995 to 2005 but it has been rising since then. The average market price has fallen by a small amount so the increase of about 60% in the retail price is entirely due to system costs. Despite suggestions that energy suppliers have pushed up prices, the reality is that most energy supply businesses are – and have been – lossmaking so that underlying system costs have increased by more than the amount shown in the figure.
Figure 2 - Comparison of industrial electricity prices, 2005-2020 [£ per MWh at 2018 prices]
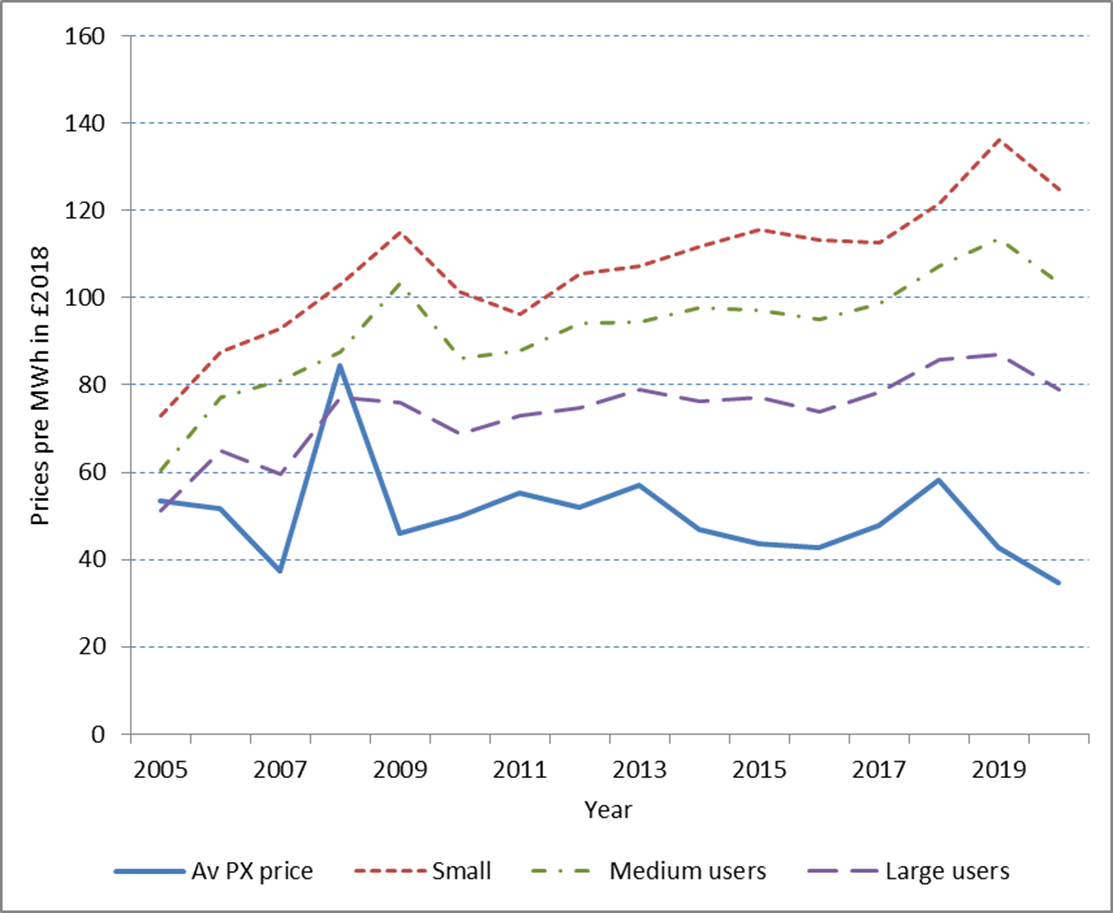
Figure 2 shows the same pattern for the prices paid by different size categories of industrial users. For each category real system costs more than doubled from 2005-07 to 2018-20. For the large user category real system costs in 2018-20 were more than three times their level in 2005-07. It is hardly surprising that energy-intensive industries are cutting back their operations in the UK.
At the same time as system costs have been increasing the overall level of final electricity use has been falling. Again this peaked in 2005 and is now 15-20% below that peak, depending on how you adjust for the effect of the pandemic in 2020. The decline has affected all of the main user categories but has been somewhat greater for industrial use than for domestic use. Figure 3 combines both demand and prices to show the composition of total revenues for the electricity sector. In this case I have subtracted estimates of total transmission and balancing charges paid by generators from generation revenues since these are clearly system costs no matter who actually pays the bills.
Figure 3 - The composition of electricity revenues, 2005-2020 [£ billion at 2018 prices]
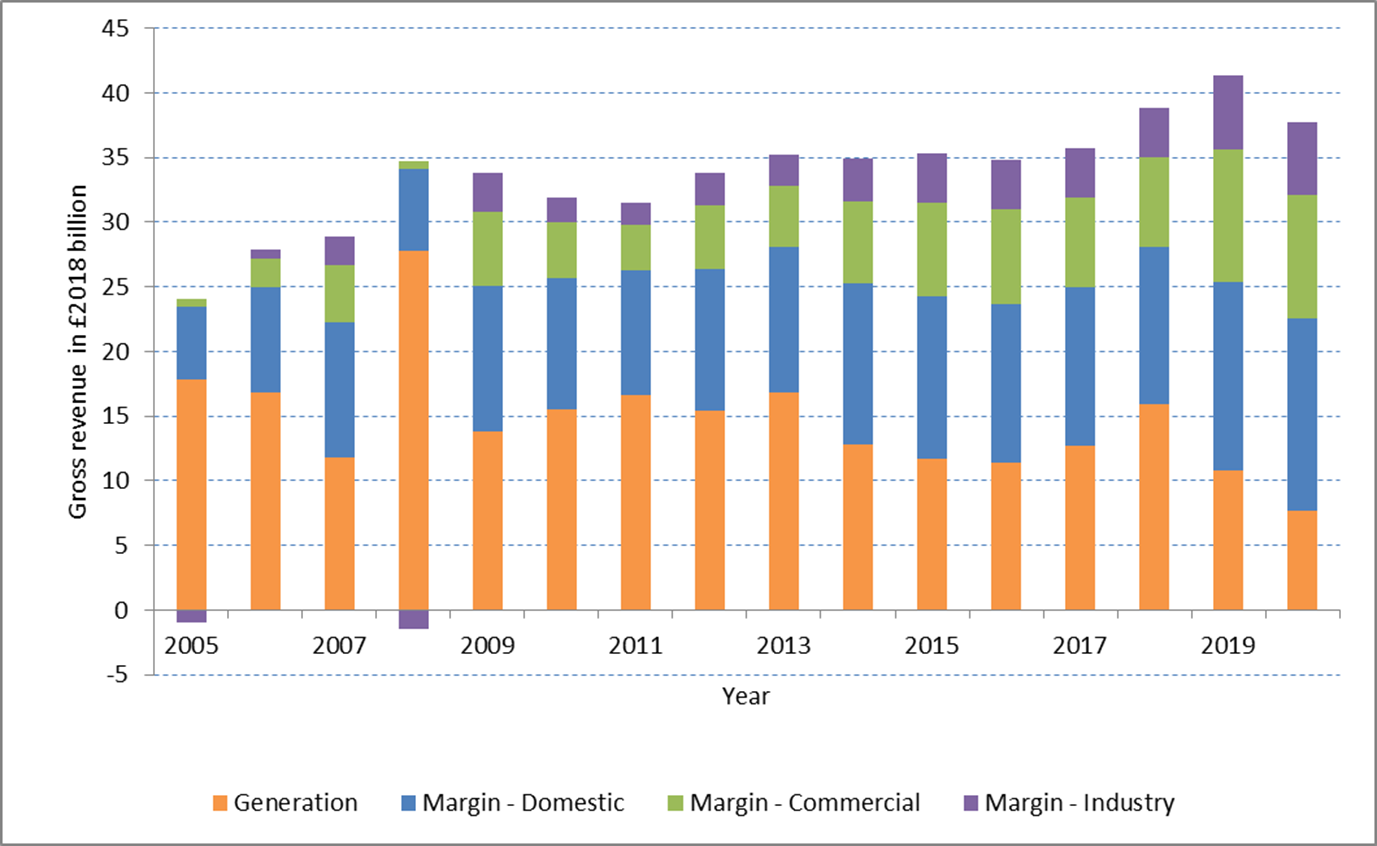
The critical point is the sharp decline in the share of total revenues that goes to cover the market value of generation costs which is shown as the orange segment of the bars for each year. All of the components reflecting system costs incurred by domestic, commercial and industrial users have increased.
The overall conclusion is reinforced in Figure 4 which shows the time series for total final use and the share of total electricity revenues that go to cover the market value of generation. As total final use has decline the average share of total revenues going to generation has fallen from 60% in 2005-07 to 29% in 2018-20.
Figure 4 - Total final use (TWh) and generation as % of total revenue, 2005-20
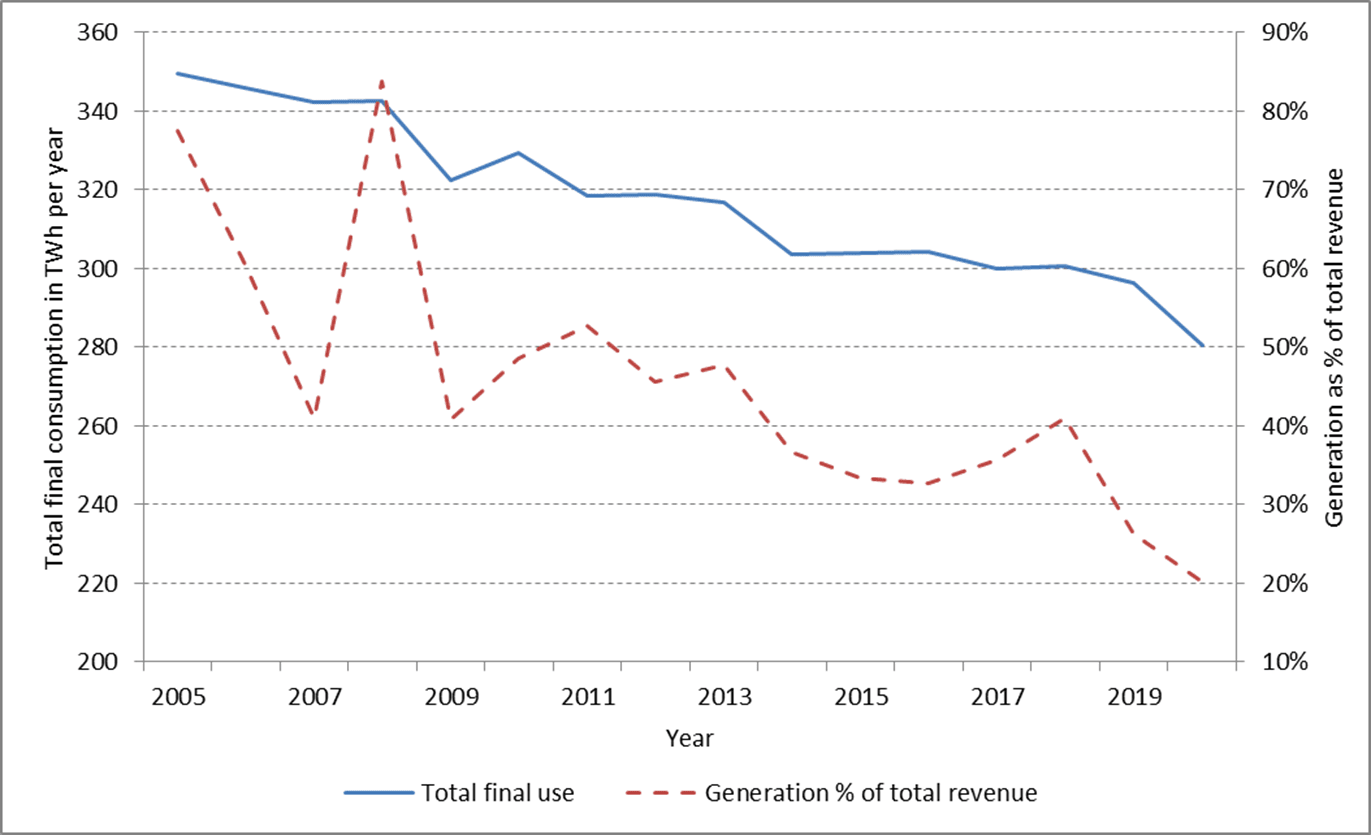
It is this structural change in the division of revenues and the associated structure of the electricity sector that is missed by those who focus on generation technologies and costs. Over the last two decades the rhetoric of energy policy has been based on an assumption that users should be encouraged to respond to energy prices at a time when the connection between the market value of electricity and what users actually pay has become increasingly remote. The link was stronger for large industrial users in the 2000s but that too was broken in the 2010s. By 2019 the system cost margin for large industrial users was more than 100% of the wholesale market price.
There are many reasons, not all of them due to policies to reduce carbon emissions, why electricity systems may not function well under the classic competitive market structure. Issues of system reliability and classic network problems complicate the idea of relying on wholesale market prices to set incentives. The period from 1995 to 2005 during which the current market structure emerged was somewhat of a golden age because the generation market was strongly influenced by small generating units with low setup costs and variable but high marginal operating costs.
The promotion of renewable generators with non-dispatchable output, high network costs but close to zero marginal costs has completely undermined the economic viability of a competitive market regime. The only reasons that this has persisted in part are: (a) the increasing gap between power market and user prices, and (b) the legacy of gas plants built in the 1990s and early 2000s which continue to serve as the marginal generation units for periods in the year.
The retirement of gas plants and the large increase in offshore wind capacity will mean that the current market structure cannot be sustained beyond the middle or the end of this decade. The volatility in market prices will simply be too large. This is already apparent in Germany and neighbouring countries. Some believe that interconnectors will underpin the current market structure, but the reality is greater integration with Europe will accelerate the transition to some different but as yet unclear market structure.
It seems inevitable that the change must involve a move towards what economists refer to as a single buyer model. Short term dispatch could remain competitive but investment in both network and generation capacity should reflect system requirements and costs rather than highly distorted incentives based on lobbying and legacy market arrangements.
Some elements of a new structure are already contemplated or underway. It is disgraceful that the System Operator was not separated from National Grid more than a decade ago. The issue is not the short term management of the network but the blurring of the line between system planning and the interests of the transmission operator in having a larger regulatory capital base. The situation in the North of Scotland is particularly egregious. From 2006 to 2021 the regulated transmission revenue for SHETL increased from £66 million to £348 million (both at 2018 prices) because of investments that substantially benefited SSE as an investor in wind generation. That pattern continues today with investment in Shetland.
With a genuinely independent system operator, system costs could be managed through a structure of incentives and charges that reflect the real costs of building and operating the network. To give an example, both short and medium term dispatch should be based on “firm” or certain power supply. The structure might involve a combination of seasonal and day-ahead contracts – equivalent to the current FPNs – with heavy penalties for both under- and over-delivery. This would encourage groups of renewable generators to invest in some combination of battery backup and gas turbines to smooth short and medium term intermittency.
The final two figures provide an illustration of how such incentives might work. I have examined the determinants of balancing (BSUoS) costs by settlement period over the last 12 years. The total sum involved is quite small – about 5% of total electricity revenues – but it has grown rapidly over the period. At 2018 prices the annual average BSUoS price has increased from £1.33 per MWh in 2010 to £4.37 per MWh in 2020. If the trend continues the average would exceed £14 per MWh in 2030.
My statistical analysis shows that the total BSUoS cost in each period is strongly influenced by the amount of wind and solar generation. Low levels of solar generation – less than 4 GW – tend to reduce overall balancing costs. Solar plants tend to be in the South of England, near major centres of load, but that benefit disappears as solar generation increases above 4 GW. In incentive terms what matters is the marginal increase in balancing cost as the overall level of solar or wind output increases.
Figure 5 - Marginal balancing costs for wind and solar generation [£ per MWh at 2018 prices]
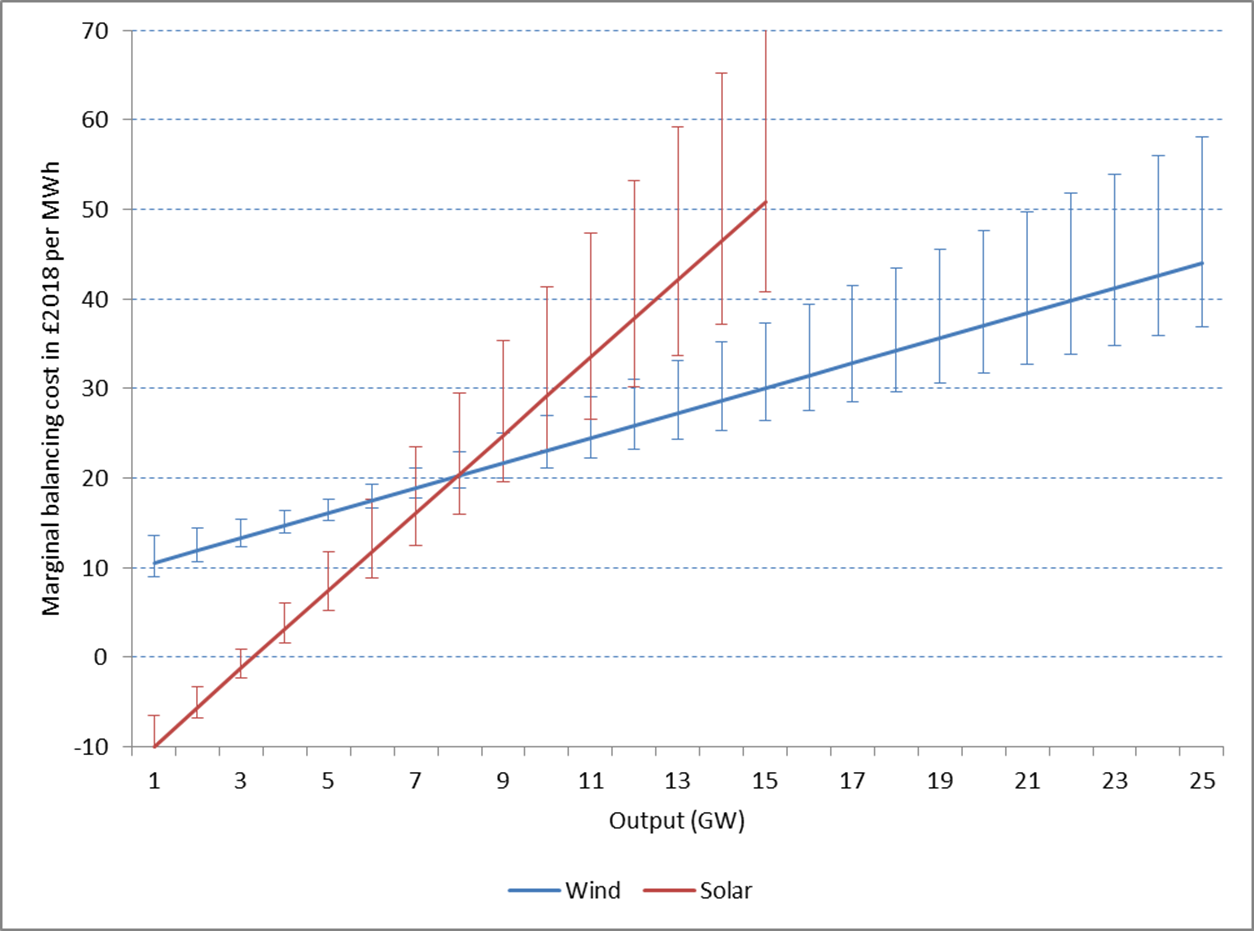
Figure 5 shows that the marginal balancing cost increases substantially as solar output goes from 4 GW to 10 GW. It exceeds £20 per MWh once solar output reaches 8 GW and increases to £38 per MWh if solar output is 12 GW. The 99th percentile of solar output in 2020-21 was 8.25 GW, so marginal balancing costs on that scale are very unusual today but they are likely to be much more frequent in 2025 or 2030.
The increase in marginal balancing costs with wind output is less steep but the 99th percentile of wind output in 2020-21 was 17 GW and that will be much higher in 2030 if the offshore capacity increases as the government plans. A marginal balancing cost in excess of £40 per MWh may apply for at least 10% of all settlement periods in 2025.
Figure 6 - Distribution of marginal net values of wind and solar output, 2019-20 [(£ per MWh at 2018 prices]
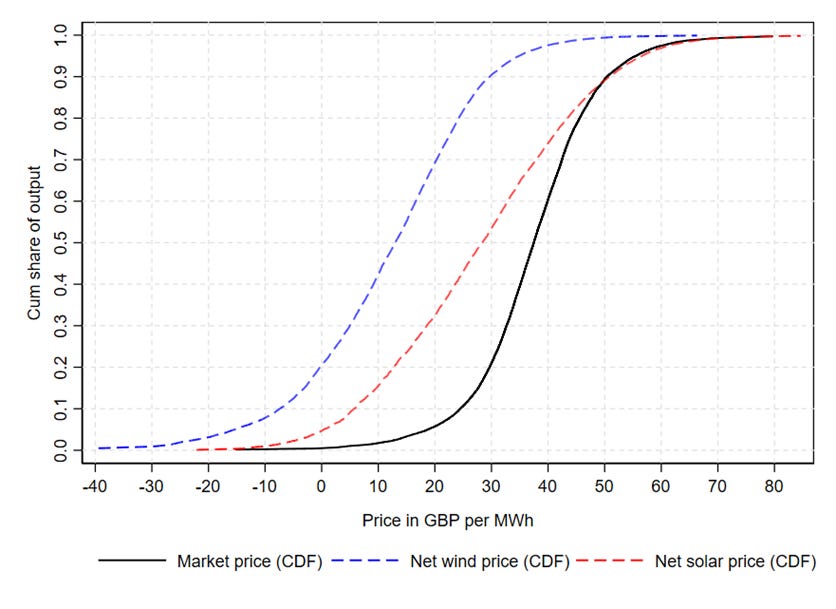
Figure 6 shows the potential effect of requiring solar and wind generators to cover the marginal balancing cost of solar and wind generation at different levels of output in 2019-20. This is entirely in accordance with the standard principle that the power market price in a period is equal to the marginal cost of dispatchable generation in the same period. The solid black line in the figure shows the cumulative distribution of total generation by market. Hence, 50% of total output was produced in periods when the market price exceeded £37 per MWh and 20% of total output in period when the price exceeded £45 per MWh.
The red and blue dashed lines show the distributions of net value for solar and wind generation if generators had been required to pay BSUoS charges equal to the marginal balancing costs for solar or wind output in each period. In the case of wind this requirement would transform the distribution of period revenues earned by generators. For 50% of output the net value of output would have been less than £12 per MWh.
Let us be clear about what this means. In 2019-20 for 20% of all wind output the net value of wind generation was negative in the sense that the impact of additional wind generation on balancing costs exceeded the market value of the output. Put differently, collectively electricity users would have been better off had some wind farms been instructed to cease production. Because these are marginal calculations the reduction in output might not have been very large but the point illustrates the magnitude of the distortions in the current system of incentives. As a note, a part of the reason why balancing costs are so high when wind output is high lies in the structure of constraint payments. These mean that it is profitable for wind farms to be constrained off the system and, even more important, for new wind farms to be built in locations with a high probability of being constrained. In this case the current system for incurring and distributing system costs is bizarre. It gives entirely the wrong incentives and puts the resulting costs on electricity users.
Stepping back from this specific example, the larger point is that the current arrangements for managing system costs are dysfunctional when system costs are much larger than generation costs as a share of the prices that are charged to users. Since it is almost certain that system costs will increase relative to market costs as decarbonisation proceeds in the next decade under current policies, it is essential that the institutional and market structure is altered to amend and update incentives to reflect the current reality rather than past assumptions.