How much do thermal power plants actually operate?

In this article I return to an empirical question that I have written about in the past, but from a different perspective. Readers familiar with my past work will know that I have examined how the performance of wind and solar plants changes as they age. In those cases, operators have every incentive to ensure that their plants produce as much as possible, as their variable operating costs are very low or zero. Thus, operators make money on almost every MWh produced – especially those receiving subsidised or guaranteed prices for their output – and have no reason to constrain output unless compensated in some way. Their output in any period is determined by a combination of reliability and resource availability.
The options for thermal power plants are more complicated. First, they must earn enough per unit of output to cover the cost of fuel and any other variable costs. Second, starting up and stopping units incurs fixed costs, not only of fuel but also additional maintenance costs, since maintenance intervals are not primarily determined by time but by the number of cold or warm starts. Operators must decide every day or every week, when and for how long their plants should run based on expected or actual prices for output and fuel as well as staffing shifts and other considerations. Such planning is not a particularly complicated problem if you are an engineer or operations research specialist, but I am frequently surprised by how little policymakers understand of such matters.
My interest was stimulated by a study of levelized costs that I am preparing for the National Center for Energy Analytics, with which I am affiliated. In collecting data, I discovered that the Energy Information Administration (EIA) of the US Department of Energy seems to assume that a new gas-fired CCGT will operate at a load factor of 87% over a physical life of 40 years. This implies that such plants operate as baseload plants with stoppages only for maintenance, usually during periods of low demand. Now, the EIA produces what are probably the best documented estimates of levelized costs, but such an assumption is utterly absurd, certainly for Europe.
Anyone familiar with electricity systems in the UK and other European countries should know that many CCGTs have been retired after lives of less than or little more than 20 years. Even ones that remain in operation have usually moved onto a one or two shift weekdays pattern of operation after 20 years and sometimes much earlier.
Hence, I thought that it would be interesting to carry out a similar exercise for some types of thermal power plants as I had undertaken for solar and wind plants, but without the adjustments for resource availability – i.e. solar radiation and wind speeds. This is not as simple as one would like because data on plant output is difficult and tedious to obtain.[1][2]
With these qualifications in mind, I have computed annual load factors for dispatchable thermal generation from grid-metered CCGTs, OCGTs, and biomass.[3] Most bioenergy plants are embedded, i.e. connected to low voltage distribution networks, rather than the high voltage transmission network, so the sample of biomass plants is concentrated on large generators which, like Drax and Lynemouth, have converted from burning coal to wood pellets or other biomass materials.
For reference, I have data on load factors for coal, nuclear and hydro plants excluding pumped storage. In almost all cases, these were units that were more than 25 years of age. In the case of coal plants, most were operating under constraints imposed by various EU directives concerning emissions and operating hours. The average annual load factor for operating nuclear plants (i.e. up to their closure) from 2010 to 2024 was 79%, for coal plants it was 74% and for hydro plants it was 32%.
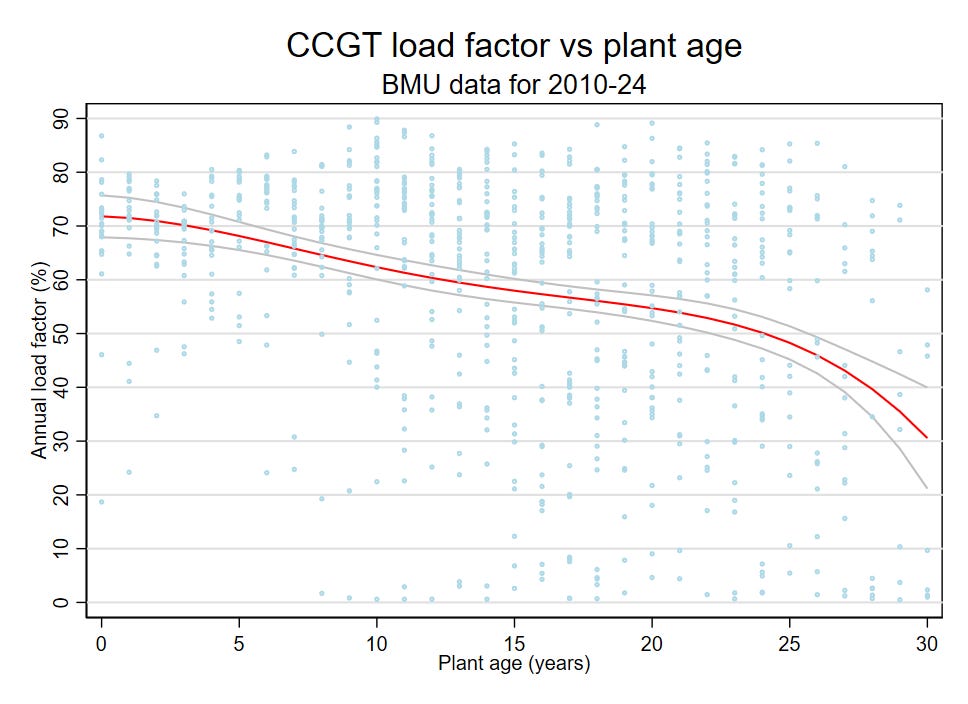
The figure above shows the distribution of annual load factors by plant age for CCGTs. It is immediately obvious that only a small proportion of CCGTs achieve and sustain load factors of more than 80% up to the age of 25 years, let alone for 40 years. The red line is a fractional polynomial fitted to the data, while the two grey lines show the 90% confidence intervals of the fitted polynomial. The results show that for the whole sample the typical annual load factor for a new CCGT is a little over 70% for the first 4 years of operation and then gradually falls to about 55% by age 20 - roughly 1 percentage point per year. After that, the annual load factor falls more rapidly to about 30% at age 30. The dispersion of annual load factors is high, especially once plants get to 10 years or older. A proportion of CCGTs maintain load factor of more than 60% up to age 25, but there is an increasing fraction with load factors of less than 20% from age 10 onwards. These are the ones that tend to be retired early.
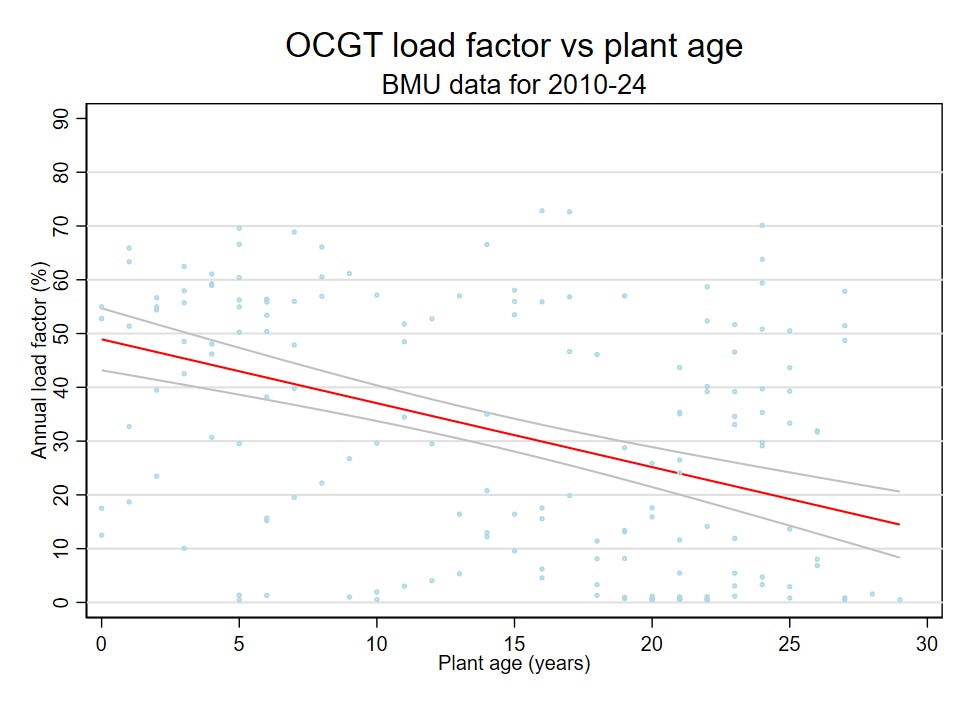
The second figure shows annual load factors for OCGTs. There are more OCGTs registered as BMUs than there are CCGTs, but most of them are small and operate for very few hours in the year. Since the number of observations is limited, the red curve is a linear regression curve fitted to the data with the grey lines showing the 90% confidence intervals. On average there is a clear decline in annual load factor as plants age. The dispersion in annual load factors is high. One possible interpretation of the data is that there are two types of OCGTs. One group has an average load factor that declines from greater than 50% to about 30% as the plants age, while the second group has an average load factor of about 20% initially declining to about 10% from age 15 onwards. However, there is no clear way of distinguishing between the two groups other than on their annual load factors. For OCGTs the clear lesson is that we should not assume that all or most of them will be used as pure peaking plants.
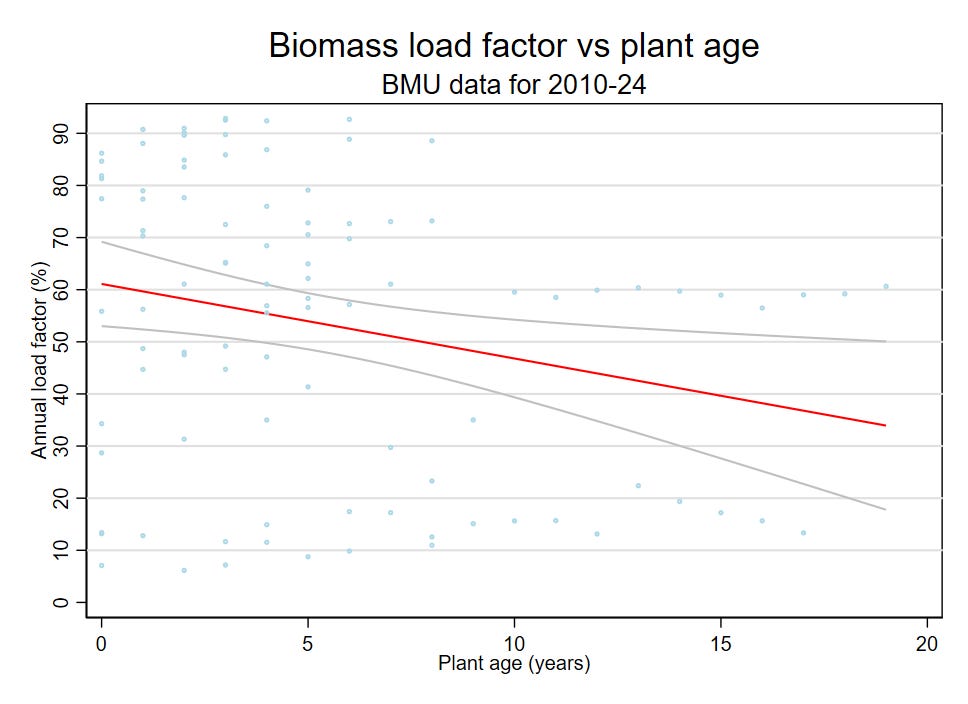
The final figure shows the annual load factors for biomass plants. None have been operating (using biomass) for more than 20 years so the scale for plant age has been adjusted. Again, the annual load factor tends to decrease with age. As for OCGTs, inspection of the data suggests that biomass plants may fall into two high and low usage groups.
For example, it is very likely that Drax intends to use its biomass units in a manner very similar to coal plants with high annual load factors. One Drax unit receives a CfD strike price of £138 per MWh in 2024-25 without any clawback during periods of negative market prices, while the other units receive a subsidy of 1 ROC per MWh, which is worth nearly £65 per MWh, on top of the market price. Drax has little incentive to pay much attention to the wholesale price of power, unless the market price is expected to be less than -£40 per MWh for an extended period. The costs of stopping and restarting its generators would exceed any saving in fuel costs by stopping generation. The converted Lynemouth power plant is in a similar situation with a CfD strike price of £145 per MWh. The MGT Teesside plant, which is a new biomass CHP plant, is even more generously treated with a CfD strike price of £173 per MWh.
The length of CfD contracts for biomass conversion – i.e. Drax Unit 1 and Lynemouth – is shorter than the standard 15 years. They expire in 2027 unless the contracts are extended, or other arrangements are made. Their operations may change after the CfD expiry as they will have less incentive to maximise their load factors, so their annual load factors may decline though they are likely to remain over 50%.
Overall, there are two important conclusions that may be drawn from these results. The first is straightforward but needs reinforcement. It is simply ridiculous to calculate levelized costs as a way of comparing generating options by assuming artificial load factors over the physical life of any kind of plant. Very few, if any, CCGTs will operate for 40 years and none will ever do so at a high and constant load factor. Assuming a modest rate of decline in an availability factor, as is done in the UK, does not remove the absurdity. If levelized costs are worth the effort – and I strongly doubt that – they must be based on real usage patterns and plant lives, not invented data. This conclusion applies equally to solar and wind plants as to all forms of thermal generation.
Less obvious but of more significance for future policy in the UK is the question of how to fill the need for backup generation in the UK as the goal of decarbonising the electricity system is pursued. There are three alternative routes that could be followed:
Alternative 1. Do nothing or very little. In effect, the life of existing CCGTs and OCGTs will be extended by offering capacity contracts. This is not a long-term solution. Over a half of the CCGT capacity in operation now is over 20 years old. The thermal efficiencies of the plants are mostly below 50% and the majority will have to be retired or upgraded before 2030. The age structure of OCGTs is not as bad – over a half their capacity is less than 10 years old – but existing OCGTs alone cannot fill the backup requirement. In any case, these OCGTs have relatively low thermal efficiencies and thus high CO2 emissions per MWh of output.
Alternative 2. Build a substantial number of new OCGTs. This would be the almost certain outcome of a decision to use the current capacity mechanism to procure sufficient new backup capacity to ensure that a system dominated by intermittent renewable generation meets current reliability standards. New OCGTs are flexible and attain levels of thermal efficiency that are much higher than older gas turbines – up to 44% is possible under the best conditions - and they have high ramp rates. They are ideal for capacity backup and peaking use, but they have higher fuel costs than CCGTs if operated with annual load factors of greater than 30%.
Alternative 3. Build a mix of OCGTs as peaking plants and CCGTs to provide the major part of the requirement for backup generation. The best modern CCGTs can achieve a thermal efficiency of over 64% in operation (Keadby Unit 2).[4] However, it is far from clear that an auction for 15-year capacity contracts would deliver this outcome. CCGTs have higher capital and fixed costs than OCGTs. They can earn an operating margin if the market price is set by the marginal cost of running OCGTs, but only if they can run for sufficient hours continuously because their start-up costs are higher. The risks of relying on market margins to cover fixed costs may be too high for potential bidders.
To get the best outcome – i.e. the lowest backup costs and the lowest level of CO2 emissions - it would be necessary to procure backup via an auction for new CCGTs that offers Power Purchase Agreements (PPAs) with some minimum level of annual dispatch at an agreed margin above the cost of fuel at a benchmark level of thermal efficiency. It is not difficult to devise such agreements, and the arrangement has been used in the Gulf and elsewhere. The difficulty is that UK policymakers have too often adopted a not-invented-here approach to contractual arrangements that differ from those that they are used to.
All of this is complicated by dogma concerning carbon capture. Even if they are trusted, analyses of the economic and technical viability of carbon capture for gas CCGTs usually rest on the assumption that plants with carbon capture operate as baseload generators with a load factors of 85% or more for 20+ years. But, as we have seen, such a model is of little relevance to the current GB electricity system. What instead will be required are plants that can operate efficiently over a range of annual load factors which might start at 80% initially but will gradually to 50% over 20 years. At the moment there is no reason to believe that this is either technically feasible or economically sensible for CCGTs with carbon capture. Maybe in future, but waiting for Godot is not a sensible way of dealing with immediate requirements.
Devising a mechanism for implementing a set of capacity payments and PPAs that would stimulate investment in new and efficient CCGTs to provide the backup generation that will be required from 2030 onwards is a soluble problem. Existing administrative arrangements for CfDs and capacity payments could be extended to cover such contracts. What matters is whether policymakers and regulators are willing to recognise that a different – and much less expensive – arrangement is required to ensure the reliability of the electricity system after 2030.
Sadly, if the record of government intervention in the energy sector over the last two decades is any guide, the most probable outcome will be somewhere between Alternatives 1 & 2 – a half-hearted scheme for capacity payments to new OCGTs but with a large element of do nothing. This will be yet another lost opportunity with worse financial and environmental results than what could have been achieved. As in other areas, the UK government is entirely hamstrung by its inability to make any strategic decisions either competently or expeditiously.
[1] I am very grateful to Lee Moroney of the Renewable Energy Foundation who provided me with detailed Elexon data on BM Units before 2020 that she had extracted and cleaned in the past. From 2020 onwards I have used Elexon’s Open Settlement Data system.
[2] The UK and other European countries have nothing like the EIA’s monthly and annual data reporting – in particularly Forms 860 and 923. Instead, it is necessary to collect data reported by system or market operators on individual generating units for every reporting period (between 15 mins and 1 hour]. Such data is voluminous (to be polite), littered with errors and poorly organized. The main sources are (a) the transparency platform maintained by ENTSOE (the European organisation of system operators) since 2015, and (b) Elexon for Great Britain (since 2010 but access is very difficult for years before 2020). The National Grid Electricity System Operator used to report Elexon data to ENTSOE but stopped doing so in 2020 – a rather petty response to Brexit as the ENTSOE covers several countries that are not EU members.
For this article I focus exclusively on the UK and have relied upon Elexon data for BMUs (Balancing Market Units). In many cases BMUs are not plants but refer to separate generators within plants. For example, the large CEGB coal plants built from the 1960s onwards had multiple turbine generators, each linked to a separate boiler, and each generator was associated with its own BMU. There were also gas turbines, usually one per generator, installed for black starts, i.e. when the station had no power, which were also registered as BMUs. For gas plants built since 1990, the practice in registering BMUs varies according to where grid meters were installed, which in turn reflect choices about operating flexibility. Most large CCGT plants have at least 2 BMUs and may also have the option of running the gas turbines without the heat recovery steam generators.
The key point is that the data used for this article is noisy, complex and sometimes partial. The interest lies in the overall patterns that can be discerned. It is also worth noting that policymakers in the DESNZ and Ofgem give every appearance of having no understanding how generators make investment and operating decisions. They live in a world of fake models and information provided by lobbyists. The lack of detailed understanding has important consequences for the costs of ensuring system reliability as the GB electricity becomes more dependent on intermittent sources of generation.
[3] There is an issue of how to measure generating capacity for BMUs. The BMU database maintained by Elexon has a field for the BMU registered capacity, but values are often missing or unreliable. Where possible I have used other public data sources on plant capacity and configuration. As a cross-check I have calculated the maximum value of output in MW for the BMU over all 30-min data periods. In calculating the annual load factors, I have used whichever is the greater of the registered/reported capacity and maximum output.
The annual load factors refer to the UK fiscal year from April to March – i.e. FY23 is April 2023 to March 2024. Since most small plants are designed for short term peaking and system management, I have excluded BMUs with a capacity of less than 20 MW from the analysis.
[4] A minor note. The thermal efficiency of gas and other thermal plants tends to be exaggerated by using the LHV (lower heating value) calorific values for their fuels. On an HHV basis the thermal efficiency of gas plants is approximately 90% of the quote LHV values.
You make a good point if technology is constant. In such cases the gradual reduction in availability, due to the increasing amount of down time for repairs would be the primary driver of any reduction in a plant's load factor. However, over the last 30 years the thermal efficiency of new CCGTs has increased from roughly 48% to 64% now. So the marginal cost of running a new CCGT has fallen by about 25%.
The effect is that new CCGTs push older one down the merit order, which means that new plants run all the time, while older plants are run less frequently and their load factors decline. The rate of decline depends on the rate of addition of new plants relative to the growth or decline in the requirement for gas generation, so the changes are not smooth or certain but over time the trend is clear.
Nuclear plants have low fuel costs and high capital costs. They are only built on the assumption that they will run for at least 40 years. They are expensive to decommission, so you don't want to do that until you have to. CCGTs (and OCGTs) are, in effect, disposable assets. They are (relatively) cheap to build and are run as long as they make money, but because their fuel costs are high it is not worth keeping them in service if the ratio of power to gas prices becomes unfavourable.
Can I offer a clarification. The decline in load factor as CCGTs is not due to a degradation in performance per se. It is a matter of choice or economic efficiency as more modern and higher efficiency plants enter the merit order above them. Older plants either can't cover their operating costs when competing with new, more efficient, plants or their start-up costs exceed the amount of money that they can make by running for 2 or 3 hours. Not only are newer plants usually more thermally efficient than older plants but a lot of effort has been devoted to reducing the cost and time required to go from zero output to 50% or full output.
There is a larger point. Advocates of renewable energy point to improvements in the size and efficiency of solar and wind plants as a result of experience and better technology. What is frequently forgotten is that gas CCGTs and OCGTs and coal plants have been transformed by technological developments over the last 30 years. One of the reasons why China and India stick with coal is that supercritical and now ultracritical coal plants are far more efficient than their predecessors. Further these improvements have been standardised. Two decades ago it was necessary to have highly skilled staff to run modern CCGTs or supercritical coal plants at close to their best. Now those skills have become widespread via standardisation.