

Geography and electricity prices - Part 2

A reader of my first article on geography and electricity prices pointed out that the fragility of the UK’s electricity system was highlighted by periods during 2024 when the cost of transmission from France to England accounted for more than one-half of the market value of the electricity. Certainly, this seems intuitively odd and raises questions about how the GB electricity market is working.
A word of warning. It is not unusual for transport costs to account for a large share of wholesale energy prices, though not in the electricity market. Anyone familiar with the gas market knows that the cost of transport for both pipeline gas and LNG often accounts for more than one-half of the delivered cost of natural gas. For a long period, the transport cost of shipping gas from Siberia to Western Europe represented nearly 90% of the delivered price in Germany. That is why Gazprom was set up as a pipeline company, not a gas producer. The same pattern applies to LNG shipped, for example, from Qatar to Japan.
These are cases in which gas is shipped 5,000 km or more. It is rarely, perhaps never, economic to transmit electricity over such distances. In the days of the Soviet Union, electricity was transmitted over high voltage AC lines from Western Siberia through Kazakhstan to the Urals and Western Russia. That never worked well as the transmission losses were high. It was clearly cheaper to transport coal by rail rather than electricity by wire. The only reason to persist with such an arrangement was the availability of large hydro resources in the Ob and Yenisei River basins.
The same logic has been used to argue for long distance transmission from the Amazon River basin to urban areas in the South-East of Brazil. The cost of electricity transmission over long distances has been lowered by switching to high voltage DC lines, but it is still very hard to make a plausible economic case for transmitting electricity more than 1,500 km. There have been various proposals to transmit solar power from the Sahara to Western Europe and England. Most of these rely on large, though often disguised, subsidies.
Still, in the case of imports from France to England we are considering distances of 51 km for ElecLink, 70 km for IFA and 204 km for IFA2. As a reference, the distance from Southampton to London is 128 km. These are similar to transmission distances with GB, so one would not expect transmission costs to outweigh payments for generation.
The relationship between transmission costs and wholesale market prices in France and England in 2024 was due to market arrangements under which interconnector access prices are determined by the difference between market prices, i.e. the causal flow runs from differences in regional market prices to transmission costs. Within the UK we are used to the reverse causal flow by which regulated transmission charges determine differences in regional market prices.

The figure above shows the average price gaps between market prices in GB, Belgium and Germany and prices in France by month in 2024. The GB market stands out with a spike in the monthly price gap of €56 per MWh in May and a trough of €16 per MWh in August. Since the price gaps for Belgium and Germany follow a different pattern without outliers in May and August, it is reasonable to conclude that the outliers were caused by factors unique to the GB market.
The standard explanation offered by media pseudo-experts – or Keynes’s (not so) long defunct economist – is that high market prices are invariably linked to high gas prices. If that were true one would expect to observe a close correlation between market prices for GB, Belgium, Germany, etc because the European gas market is very closely integrated. There are spot gas markets in many European countries, but they are very closely linked to the benchmark TTF natural gas prices for both spot over the counter (OTC) and futures contracts.[1]
The figure below shows the ratio of the daily wholesale day-ahead market price divided by the TTF natural gas price – both in € per MWh – and then averaged over each month of 2024 for four countries.

For Belgium and Germany there is a clear pattern. The average ratio of power to gas prices tends to be highest between November and January. It falls in the spring and remains low until rising again in the late summer and autumn. There is a logic behind this pattern. Demand for power tends to be highest in winter, so that the plants with highest variable costs must be paid enough during the winter to persuade them to run. As demand falls – and solar generation picks up – the output required from plants with high variable costs falls. Only the most efficient plants, i.e. those with the lowest variable costs, will continue to operate. That pattern is reversed once demand picks up in autumn and output from solar plants declines.
The GB market is somewhat different. First, the average ratio of power to gas prices was significantly higher than for the other three countries from January to March 2024. Second, if we treat the sharp falls in April and August 2024 as outliers, the overall pattern of a U-shaped decline and recovery in the power to gas price ratios was much flatter than that in the other countries.
The graph tells only a part of the story. The variable cost of running a gas plant in the EU and GB depends on the gas price but also on the EU or UK carbon emissions price. I have calculated the minimum ratio of the power price to the gas price necessary to cover the sum of gas and carbon costs based for the EU and the UK for gas CCGTs with thermal efficiencies of 54% and 50%.[2] A thermal efficiency of 54% should be achievable by modern CCGTs - built within the last decade – but not by older plants, while a thermal efficiency of 50% corresponds to the average value achieved by UK plants in 2024.
Using the EU ETS carbon price the minimum power to gas price ratio required to cover variable operating costs varied from 2.59 in January-February of 2024 to 2.36 in November-December. The average monthly power to gas ratios in Belgium, Germany and the Netherlands only exceeded those values in January and November 2024. While it may have been worth operating gas plants on some days in February and December 2024, for the 8 months from March to October 2024 it would have been consistently unprofitable to operate even modern CCGTs - see figure below.
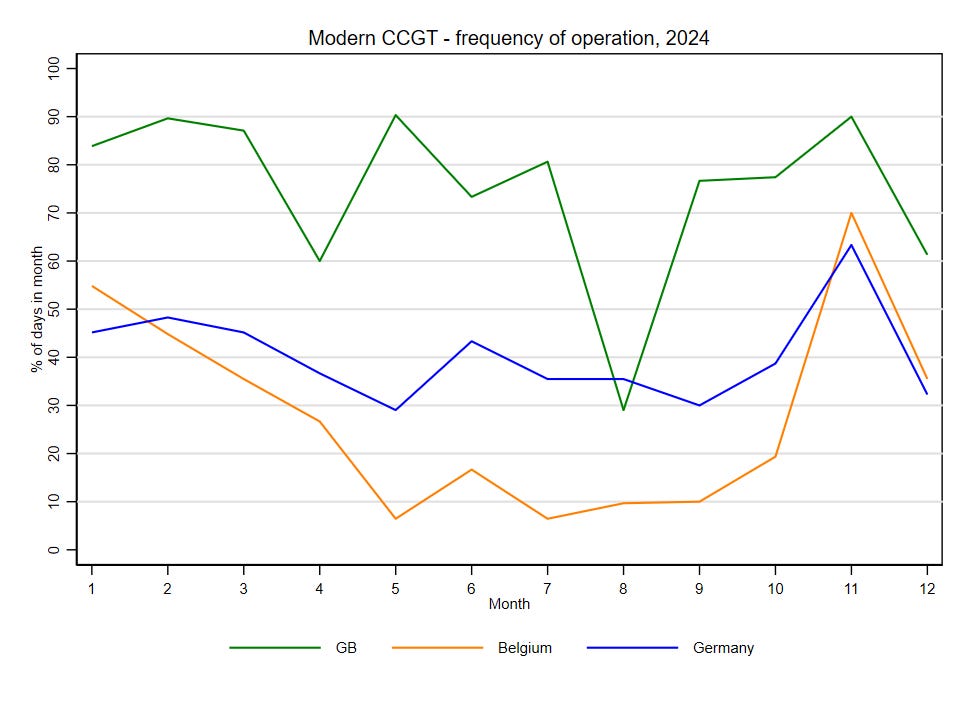
Again, the situation for the GB market was different. Using average monthly power to gas price ratios it would have been profitable to run a modern CCGT in every month other than April and August 2024. It would also have been worth running a CCGT with a thermal efficiency of 50% in most months of 2024 other than April and June to August. Of course, power prices fluctuate hourly. Monthly averages do not mean that it would have been worth operating for every hour in the month, though this might have been profitable after allowing for start-up and stopping costs.

The key element in the monthly variations was the amount of solar and wind generation – see the figure above. Since variations in solar output by month are closely linked to the number of daylight and the angle of solar irradiance. Wind output was high in April and August but low in May when compared with the expected pattern of seasonal variation. Hence, the high and low values of the price gap between market prices in GB and France were the consequence of lower than expected wind generation in GB during May 2024 and higher than expected wind generation in August 2024. Such divergences do not always lead to spikes or troughs in the price gap because other factors can buffer their impact. Higher than expected wind output in April 2024 did not lead to a collapse in the price gap between the GB and French markets because market conditions in France and Spain resulted in both French and Spanish prices being substantially lower than usual for the month.[3]
The key lesson from 2024 is that gas prices are far from being the only or even primary driver of variations in market prices in the UK. The increasing reliance of the GB market on imports from France, either directly or indirectly, has meant that GB market prices are no longer driven by what happens to gas prices. The relationship is complicated by constraints on interconnector capacity and the arrangements for auctioning access to that capacity.
As I have illustrated, lower or higher than expected levels of wind generation in the UK can easily push up or push down GB market prices depending on (a) market conditions in France, and (b) whether interconnector capacity is fully utilised. The result can be extreme variations in the level of interconnector costs to reflect either (relatively) high or low levels of the price gap between French and GB market prices.
While politicians, journalists and others may have difficulty in understanding complex market interactions, we should put aside simple fairy stories about why electricity market prices in the UK can be so volatile. Indeed, by choosing to increase interconnector capacity between England and Western Europe the government is, perhaps unwittingly, choosing to increase the volatility of GB market prices. While the result may be less dependence on gas generation, the impact of external influences on UK electricity prices may increase significantly. This is not quite the story that is usually offered.
[1] The TTF gas price is the benchmark price for gas trading in Western Europe. TTF (Title Transfer Facility) refers to a virtual trading point for natural gas in the Netherlands which was established by Gasunie in 2003. It is now the most liquid gas market in Europe and is used in pricing both pipeline and LNG imports. The standard pricing terms are in euros per MWh calculated using the HHV, which facilitates cross-market trading in power and gas. Physical settlement of TTF contracts is possible within the Dutch gas network, but most trading is purely financial. Futures contracts are traded on the Intercontinental Exchange (ICE) for periods up to 5 years ahead, though the month-ahead contract is the most active. There are day-ahead prices quoted that are based on OTC trading. The figures used here are the month-ahead futures contract – i.e. trades in May 2025 for notional daily delivery in June 2025 – which is the standard benchmark for current gas prices, since almost all trades are settled financially. The differences between OTC trade prices and month-ahead prices are typically very small – less than €0.20 per MWh.
[2] The calculations use the high heating value (HHV) definition of gross calorific value. For gas, the LHV value of gross calorific value is about 90% of the HHV value. Manufacturers tend to quote thermal efficiency on an LHV basis because the numbers look better. On an HHV basis, the thermal efficiency of modern CCGTs can be up to 58%, though very few plants achieve that level of thermal efficiency on a sustained basis. An average thermal efficiency of 54% (60% on an LHV basis) is good for modern plants. The average thermal efficiency for UK plants in 2023 is reported to be about 50%. I have assumed CO2 emissions of 0.185 metric tonnes per MWh of natural gas and have used daily EU and UK ETS prices for CO2 emissions.
[3] The primary reason for lower prices in France and Spain was relatively high production from hydro plants in these and other countries (especially Italy) because of abundant water from snowmelt in the Alps and Pyrenees.
Thank you Gordon for another embarrassment of riches. You, David Turver and Kathryn Porter have saved me wasting my time with mainstream media accounts of energy prices.
On a point of detail, I believe that in footnote [2], the second sentence should end with "HHV value".