

Geography and electricity prices: Part 1

This is the first part of a series of (probably) three articles focusing on geographical influences on electricity prices. The series is prompted by proposals to introduce zonal pricing of electricity in the UK. The idea will be unfamiliar to most British and European readers, but zonal pricing is widely used in the US. It is a natural consequence of market operation in large geographical units and/or high transmission costs. I will explain that, while there are good grounds for adopting zonal pricing in the UK, the case made by its primary proponents is both disingenuous and highly misleading. However, before I address the options for the UK, I would like to step back and discuss how geography influences electricity prices by considering trade between countries in Western Europe, focusing on the role of France.
Apart from 2022 when its nuclear power plants were undergoing emergency repairs, France is the most consistent exporter of electricity in Western Europe. It has power connections to Belgium, Germany, Italy, Spain and Switzerland in addition to Great Britain. While it may not export to all of these destinations at the same time, it was a net exporter of power in 92% of hours in 2024 and 95% of hours from January to April in 2025. In contrast, during 2022 when its nuclear problems were at their worst, France was a net exporter of power only in one-third of hours during the year.[1]
The spatial economics of electricity prices in Western Europe is complicated by the way in which capacity on the various links between countries is allocated. In most cases, transmission capacity is auctioned by hourly slots, but contracts are awarded over time periods varying from yearly and monthly to daily. Intraday or spot trading is used by power companies to adjust the amount of capacity that they have contracted in advance to match the volume of power that they wish to transmit.
The total interconnector capacity between France and Great Britain is 4 GW (IFA, IFA2 and ElecLink). For transmission from France to GB in 2024 an average of 1.8 GW was committed on yearly contracts and 0.9 GW on monthly contracts, while the average amount of capacity traded on daily contracts was 2.3 GW. The total of these items exceeds 4 GW because capacity on longer term contracts was resold, usually on a day-ahead basis. Spot trading was less important with an average amount traded of 0.7 GW.
Trading generates huge amounts of data, so it is often hard to make sense of the underlying patterns. The figure below shows the average price paid for transmission capacity between France and GB during 2024 for each day in 2024 for 3 contracts – year-ahead, month-ahead and day-ahead. Ignore the blips in the year-ahead contracts as those reflect artificial effects when one contract period expires and a new period starts.
There are three core features of electricity trade between the two countries illustrated by Figure 1 below:
Figure 1

First, there are very large day-to-day variations in that amount that electricity traders are willing to pay for transmission capacity. This reflects the stochastic nature of weather and other factors which influence generation, demand and thus market prices in GB and Western Europe.
Second, underlying that randomness any trader which was willing to agree to an annual contract could acquire transmission capacity at about €11 per MWh. The capacity price was much lower than the average price paid by traders on either month-ahead or day-ahead contracts. This would appear to offer a huge arbitrage opportunity for any trader with the resources to buy capacity on year-ahead contracts and sell on month-ahead or day-ahead contracts.
There is one major constraint: how would EDF act? As a company, EDF has a very large presence in both France and GB plus huge financial resources, putting it in a dominant position for longer term contracts. Other traders may wish to avoid being on the wrong end of trades dominated by EDF. The general point is that the more complex are market arrangements, the more likely it is that individual markets are dominated by specific companies whose interests happen to match the market characteristics. It is very difficult to design market structures that avoid the risk of such domination.
Third, the monthly average prices for month-ahead contracts varied between about €9 per MWh in February and about €42 in May and July with an average of €24 for the year. The average for day-ahead contracts over the year was €27, so that the difference between month-ahead and day-ahead contracts has largely been removed by arbitrage once allowance is made for the difference in risk. The difference between the month-ahead contract prices in summer and winter is very striking. For December to March the average month-ahead price was €11.6 per MWh, whereas for May to August the average was €38 per MWh.
These movements in the month-ahead cost of transmission capacity tell us that the expected difference between wholesale market prices in France and GB widens greatly from winter to summer. No electricity trader will buy transmission capacity unless it expects that it can profit by buying electricity in France and selling in GB after paying for transmission and any other costs.
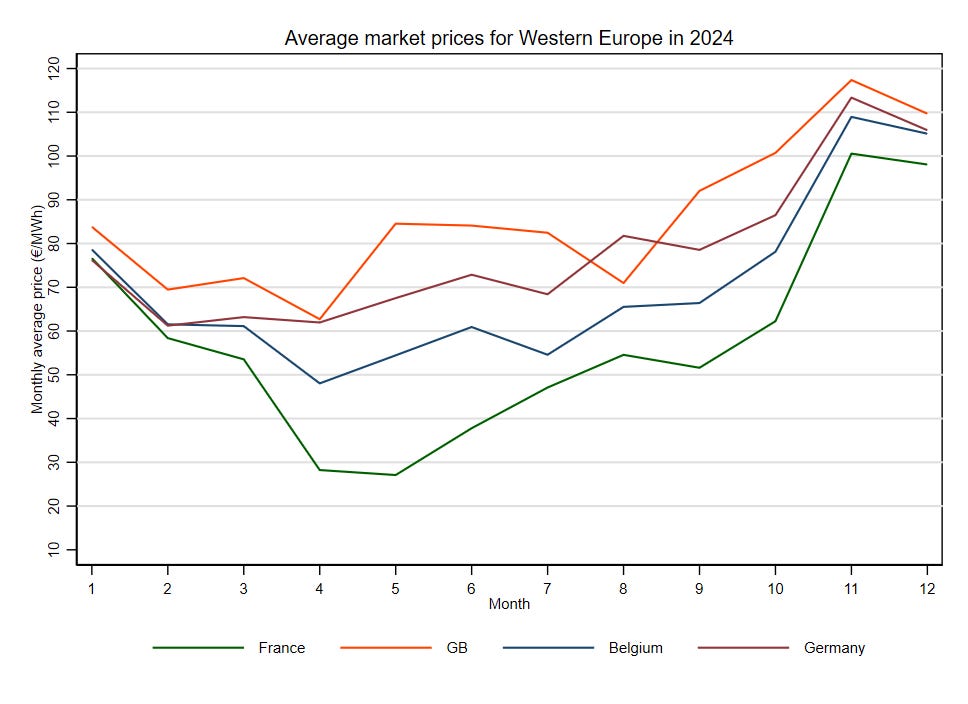
Figure 2 shows the pattern of monthly average market prices in 2024 for France and three neighbouring countries that are net importers from France – GB, Belgium and Germany. The average market prices span a narrow range in January but progressively drift apart up to May when the monthly average price in France is at a minimum. From June onwards the gap narrows as the average price in France increases, but it remains large until October and the onset of higher demand as both daylight and temperatures fall. By December the gap has reverted to nearly where it was at the beginning of the year.
Figure 2
In the next graph I examine whether traders could make money by buying transmission capacity on monthly contracts for both exports from France and imports to France from neighbouring countries. I assume that they use the capacity to (a) export power from France when the day-ahead market prices are lower in France than in the destination country, or (b) import power to Fran when the day-ahead market prices are higher in France than in the origin country. The graph shows the monthly average margins earned from such trades. The monthly transmission contracts are a fixed commitment whose cost can be justified if, on average, the differences in market prices are sufficiently high.
Figure 3

Figure 3 shows that there is considerable variability in the average trade margins, which are negative in some months. Nonetheless, for each of the four countries shown the average trade margin over the year is positive, varying from €3.8 per MWh for Belgium to €5.1 per MWh for GB. The average margins for trade with Switzerland and Italy are higher – between €8 and €10 per MWh – which suggests that regulatory arrangements are less effective at promoting competition for trade across these borders.
Various more complex trades are possible.[2] If the market for day-ahead capacity contracts is sufficiently active, a trader with a month-ahead contract can choose between selling transmission capacity in the day-ahead market or using the capacity to trade power. In the case of trade between France and GB, that option increased the average margin that could be earned by traders in 2024 from €5.1 per MWh to €7.6 per MWh.
While these margins may seem to be relatively small, the total margin revenue for exports from or imports to France was more than €1.4 billion in 2024. The largest components of both total trade margins and total volumes traded were trade with Belgium and Spain. Each country accounted for about 30% of total trade margins. Germany and GB were very similar and each accounted for about 10% of total trade margins. The average flow of power between France and Belgium over 2024 was 7.5 GW and between France and Spain was 7.0 GW. In comparison, average trade flows with Germany and GB were much lower at about 2.4 GW in each case.
When considering their own electricity systems, many countries have the tendency to think of themselves as the centre of the known universe. The crucial lesson for the UK that can be drawn from this analysis is that trade with the GB market is not especially important to France. Because of its large nuclear fleet, France is the behemoth of power trading in Western Europe. The French electricity system is closely linked to the power systems in Belgium and Spain. The high volumes of power traded between France and these two countries mean that the average trade margins are relatively low.
The average cost of transmission between France and GB on yearly and monthly contracts is considerably higher than for Belgium, Germany, Spain and Switzerland. Transmission between France and Italy is even more expensive, because geographical barriers limit transmission lines and the volume of power that traded. For example, the average cost of transmission from France to Belgium in 2024 was €9.3 per MWh for monthly contracts, whereas the equivalent cost of transmission from France to GB was €23.9 per MWh. GB and Switzerland are the only countries with day-ahead capacity markets and again the cost of transmission capacity from France to GB in the day-ahead market is higher than transmission capacity to Switzerland.
In the phrase coined by a commentator, the UK is a semi-detached participant in the European power market. Perhaps more important, the relationship is highly asymmetric. In addition to imports from France, the GB power market relies on imports over the interconnectors to Belgium and the Netherlands, both of which are closely linked to France. The UK should not expect special consideration for the requirements of the GB market in the event of market stresses.
There is a second point highlighted by the data examined in this article. Both economists and journalists tend to think of transport costs as being fixed in the short term. That leads to the assumption that the price differences between interconnected markets are stable over periods of months or even years. However, that is certainly not the case for power transmission.
The market costs of transmission capacity vary greatly over time and are linked to differences in power market prices. In effect, power prices and transmission capacity prices are interdependent, so that the levels of trade between different power markets establish a balance between the demand for and the supply of power in each market. The result is both more variable and more complex than we are used to thinking about when transport costs are fixed.
This conclusion is important when we come to address the potential consequences of adopting zonal pricing in the GB market. Up to now businesses and households are used to the idea that there are stable differences across regions in the prices paid by final users. These differences are determined by differences in average transmission and distribution costs. That will no longer be the case if zonal pricing were to be adopted, unless energy suppliers are willing to absorb the costs of variability in zonal market prices and transmission costs.
In the next article in this series, I will examine how zonal pricing works in the US with a specific focus on the PJM Interconnection. It covers the US Mid-Atlantic region from New Jersey to Virginia and as far west as parts of Kentucky and Illinois. The population covered by the PJM Interconnection is about 65 million, very close to the population of the GB market in the UK.
[1] The data used in this article has been extracted from ENTSO-E Transparency Platform database, supplemented by data reported by Elexon for the GB market. For anyone thinking of using ENTSO-E database, it essential to understand its strengths and weaknesses. The database contains a vast amount of data of distinctly variable quality and often inconsistent organisation. Various types of geographical units (bidding zones, control areas, and countries) and time periods are jumbled together, while the organisation and updating of the data is erratic because this is left to individual members of ENTSO-E. If any reader is willing to put in the effort required to understand data definitions and quality, the database can be very useful. However, no-one should treat it as a source of carefully curated data, as some of the data series are close to complete nonsense. Unfortunately, as I have reported in an earlier post, National Grid & Elexon were among those reporting patently absurd figures to ENTSO-E in the past – in particular generation from solar, offshore and onshore wind.
[2] The range of trading options is even greater if simultaneous trades in day-ahead and futures markets are considered. It is not my intention to cover all possible trades but to focus on trades in markets that have substantial liquidity and trading volumes.
Fascinating analysis. I've started to delve into interconnector trading. For the UK the rules differ significantly between the various links. For example, IFA1 is able to secure congestion revenues almost without limit. The adjacent Eleclink that goes through the Chunnel has a revenue cap beyond which it shares revenue with IFA1. IFA2 is subject to the OFGEM cap and floor regime.
Clearly EdF uses year ahead commitments to underpin hedge sales of production from Gravelines and Penly into the UK market, though the seasonal differences seem to be driven in part by continental solar pushing down prices. The huge arbitrage margins are in part supported by the UK no longer being part of the EU market coupling regime, so there is no implicit trading of interconnector capacity and power at each end. It leaves traders with risk arising from timing differences in auction deadlines in the DAM and interconnectors trading arrangements.
I know that before the market coupling arrangements some traders would buy capacity to block efficient trade between countries, allowing a higher price and more volume for the output of generators they owned (I was aware of such trades over NL-DE links for example). A general observation otherwise from the economics of arbitrage is that once a link (or at least the available capacity on a link) is fully utilised it no longer can influence prices at either end. Only more circuitous routes can do that.
There are potentially huge conflicts of interest for National Grid. It can make huge margins on interconnectors that are increased by having an inefficient domestic grid and connection regime. Some of these also depend on the renewables subsidy regime. I get the feeling OFGEM doesn't really understand how it all fits together to the disbenefit of UK consumers.
I'm all too aware I've only scratched the surface so far. Your analysis is a huge help in thinking about the wider implications.
This tells you how bad things have got in the UK electricity market when its still economic to pay the owners of the HVDC cable link upwards of E10/MWh to transmit power and still be cheaper than sourcing it within the UK.