

Does anyone know the level of UK offshore and onshore wind generation?

The question in the title of this article is a leading one. As you might expect, the answer is no – and that is a matter of considerable concern. The current government has been busy making statements about its goals for 2030, committing money and issuing action plans to achieve these goals. The National Energy System Operator (NESO) has claimed – subject to various implausible conditions – that the goals for 2030 can be met without frequent blackouts or unacceptable costs.
Yet, if you look at the details, neither NESO nor the government have any reliable idea of what generation was last month, let alone what it will be a year or 5 years from now. This appears to be a classic case of the blind leading the blind.

The graph above gives a sense of the issue. There is nothing special about the date chosen as the discrepancies and variability in some measures are similar for most days. Indeed, I realised that there was a problem about a year ago when, for my amusement, I plotted figures reported for April Fool’s Day in 2023. This was no prank, because after repeated checks I realised that the wind output figures published by what was then the National Grid Electricity System Operator and is now NESO were close to being random variables.
The measurement of electricity output relies ultimately on aggregating data collected by meters which monitor the amount of electricity dispatched by generators – from nuclear plants to wind and solar farms – through their connections to the transmission and distribution systems. However, many of these meters are not visible to the system operator because the generator is connected to its local distribution network and the unit is not registered to participate in the Balancing Market (BM). These are called embedded generators and are seen as negative demand from the point of view of the grid.[1]
On top of this there is an extra layer of complexity arising from the division of roles between NESO, as system operator, and Elexon, which manages what is called the Balancing and Settlement Code. In any rational world, the system operator would collect and publish data on generation by type of generation and generation unit to the extent that such data can be collected from meters visible to the system operator.
Unfortunately, NESO does collect this data, but it passes it on to Elexon who publish it. If you check the NESO Data Portal this offers data on what it calls “demand”, though that is based on a very elastic definition, but not a squeak on current generation though NESO does provide forecasts of future wind and solar generation as well as, under demand, estimates of past generation from embedded generation. The situation has been exacerbated both by the transition from NG-ESO to NESO and by the apparent pressure on Elexon to meet the desire of traders to focus on API access to their data rather than public accessibility.
That pressure has resulted in the replacement of a somewhat clunky but system of what were called BM Reports by a new Insight Solution website that is quite astonishingly poorly implemented. The name alone tells you everything you might guess. Equally important, Elexon seems to be completely unconcerned about data quality provided that it is dressed up in flashy clothes.

The table shows estimates of generation by fuel type for GB reported from two Elexon sources for the same half-hour settlement period on 22nd December 2024. The first column is taken from the FUELHH dataset which has been published for nearly two decades in various forms. It does not separate offshore and onshore wind nor does it cover solar generation. The second column is taken from the Generation by fuel type which is described as an indication of the generation outturn aggregated by fuel type category.
The more detailed explanatory text might be interpreted as implying that imports via interconnectors are assigned to fuel categories in some unspecified way. Unfortunately, that is simply inconsistent with the data. For example, in this settlement period imports from France amounted to nearly 3 GW, and from Norway was 1.4 GW. None of these amounts were allocated to the nuclear (France) and hydro (Norway) categories. There is almost no offshore wind generation in either France or Norway, so reallocated imports cannot explain the very high estimate of offshore wind generation in the FUELAGG column.
This brings me back to the figure above. The blue and purple lines labelled NESO - AGG and NESO – HH correspond to the FUELAGG and FUELHH data series respectively. The pattern of variations in total wind generation over the day reported by the FUELAGG doesn’t correspond to any real data series and any smoothed series is far below the other two series.
The red line in the figure is the most reliable estimate of total wind output, but it is not available on a contemporaneous basis. I have constructed the series by taking the SF output figures reported by each BM registered generator as reported at the time of final settlement, allocating each BM unit to a fuel category, and aggregating by fuel category. In theory, the process of constructing the FUELAGG should be identical except for the use of current rather than revised output data for each BM unit. Clearly, something is fundamentally wrong with the FUELAGG procedure, leading it to yield absurd estimates of wind generation.
However, does this matter to anyone other than statistical nerds? Sadly, it does. Compiling what I refer to as the “Elexon – BM” requires a lot of effort and the data is always 3-4 weeks behind the current outturn. The FUELHH estimates are not a substitute because they provide no breakdown of wind generation nor any data on solar generation. Such missing data hampers any attempt to assess the viability of the current government’s 2030 decarbonisation strategy. Indeed, it is hard to work out how NESO could have made the statements that it did about this strategy while relying upon its own – completely unreliable – data. Their assessment has the character of fiction built on a base of conjecture and random numbers.
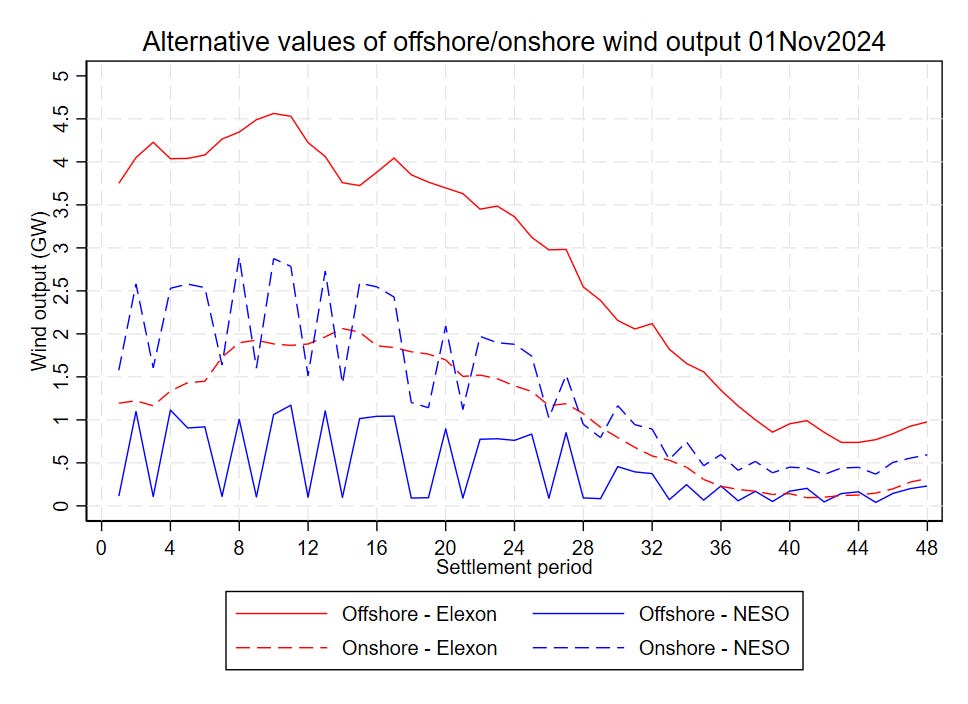
This point is illustrated further by the figure below. The solid red line shows estimates of offshore wind generation based on the detailed Elexon BM data, while the red dashed line shows the matching estimates of onshore wind generation. The blue solid and dashed lines are estimates of offshore and onshore wind generation as reported in NESO’s FUELAGG data. Not only do the latter contain large random variations but they provide an entirely different picture of the relative importance of offshore and onshore generation. If the Elexon BM estimates can be trusted, offshore wind accounted for more than two-thirds of total wind generation on 1st November 2024. If a smoothed version of the FUELAGG figures were used, that conclusion would be reversed.
Which is right? Naturally I am inclined to believe the results from my analysis. Still, it would be reasonable for someone of a sceptical inclination to insist that the apparently absurd results produced by NESO for its FUELAGG data should be investigated to understand what is going on and, if necessary, correct the errors. The notion that NESO, as the primary agency responsible for developing and implementing the detailed strategy underpinning the current government’s plans is content to publish nonsensical data on a critical aspect of the strategy is profoundly disturbing.
[1] For anyone with a detailed knowledge of electricity data I should emphasise that my discussion in this article deals strictly with estimates of output from grid-connected or grid-visible generators. There are well-known issues concerning estimates of wind and solar power produced by embedded generators, which are little more than artefacts derived from obscure and poorly documented statistical models. I have little to add other than to note that for a developed country to rely upon such scandalously bad data for managing its electricity system highlights the fundamental lack of seriousness that is characteristic of the UK’s approach to managing its energy sector.
Data on ROC embedded generator is reported through https://renewablesandchp.ofgem.gov.uk/ albeit with quite a lag to the public anyhow so theoretically possible to do a back check. Mind you how much of embedded wind is covered by ROCs im not sure as there also FiT wind generators as well of course.
I also looked at the metering requirements for ROCs and doesn't appear that automated data collection was mandated for the subsidy payment although I imagine the majority do do that for contracts with suppliers or traders. You would have also thought that for the system operator as well as the DNOs better visibility of generation on the system now was essential and rather than pissing money away on consumer SMART meters they would have dealt with embedded generators first.
Anyhow thanks for providing thought provoking posts and seasons greeting to yourself and fellow readers.
Recently I reviewed the EV charging regulations 2021 which include:
A relevant charge point must be configured so that it is able—
(a)on each occasion it is used, to measure or calculate every one second the electrical power it has imported or exported (as the case may be), such measurement or calculation to be in watts or kilowatts; and
(b)to provide the information referred to in sub-paragraph (a) via a communications network.
Yet we have large numbers of generators that provide no remote metering at all. True, EV meters are only required to be accurate to +/-10% which is a large tolerance. Control of solar will become a big issue if we add significantly to the present installations. To really understand what batteries are up to you need high resolution data as they often alter output/charging on very short timescales, particularly when providing ancillary frequency services. I've seen some 4 second data from AEMO which shows that even the 5 minute data can hide important detail: in any event it is important to separate out charging from discharging so that at least the round trip efficiency can be monitored.
Reviewing some of my previous downloads I see that Elexon have changed what is packaged together. Interconnector data are for the most part in separate data downloads. Downloads for individual BMUs include any imports for battery/pumped storage pumping and to meet parasitic demand of windfarms for keeping the blades turning during Dunkeflaute etc. The coverage of wind has long been a mystery, but I think it is slowly being sorted out, yet is still a mess. I have found a number of cases of fairly obvious data glitches, also affecting CCGT. If you look at this chart (which blows up to allow examination of detail)
https://i0.wp.com/wattsupwiththat.com/wp-content/uploads/2024/08/Generation-jan-2023-1722888879.3157.png
you will see there is a significant glitch on 24th Jan 2023 with an hour where there is no report for Biomass, and some of the other figures for CCGT, nuclear and probably wind are suspect. Reviewing my analysis of 2023 which I did at hourly resolution so that charts per month are legible I see similar glitches occur roughly monthly: some may last slightly longer.
I think the AGPT/B1620 data include embedded wind at least as an estimate whereas the prompt data only includes transmission connected BMUs. This may change as NESO start to move towards their Open Balancing Platform: they have recently been forced to put in new facilities to allow for bids and dispatch for distribution connected batteries, so they are starting to acquire some visibility of life beyond the transmission network. At least the per BMU B1610 data includes any use of electricity for charging batteries, pumping hydro and keeping wind turbines turning during Dunkelflaute periods as negative generation. The treatment of parasitic loads probably differs among the sources: those that rely on accredited metering will of course tend to reflect data adjusted for revised loss estimates etc. as each update run occurs.
I was shortly going to be attempting to assemble a detailed picture for 2024 (waiting for the data that only comes through in arrears like CFD payments). It may be useful to tackle the insights team as a wider project for those of us who are interested in research based on longer runs of historical data to try to get them interested in repairing the data glitches and providing convenient download options. It is enormously frustrating that unless there is a "stream" version of data the time range of downloads can be very short (a severe handicap of BMRS it has to be said), and yet the stream version only allows JSON output which is unnecessary verbose and involves extra conversion steps via csv to make it usable in most forms of analysis. They also need to pay attention to precise definitions of what is and isn't included in the data and trying to make some of it more user friendly: we could do with data on BMUs that gives more readable names, geographic coordinates, capacity, and probably any linkage to CFD and ROC payments.
I did try to suggest some ideas when they were switching to the new system, and got told it may be a long time before anything happens...