Assessing weather variability and climate adaptation

I apologise to readers of these articles who sometimes find the more technical material hard to take. Parts of this article may provoke the same reaction. On the other hand, I feel that it is important to counter some of nonsense put out by climate emergency advocates, often supported by pseudo-scientific twaddle from agencies and people who ought to know better. The formulation of policies based on probability and risk analysis is among the most difficult areas of economics to explain to the public – and other economists! The problem is exacerbated by media focus on human-interest stories and by the way in which meteorological agencies have sought to stimulate interest by promoting click-bait stories. While extreme weather events are, by definition, infrequent occurrences in particular locations, they are routine when we examine them in a wider context and over long periods of time. That is the basis of the statistical of extreme values which is used here.
In September 2024 a major Category 4 hurricane in the Gulf of Mexico – Hurricane Helene – came over land on the north Gulf coast of Florida and moved north over Georgia. It was downgraded to a tropical storm and continued to move north over the Carolinas and eventually Virginia. As the strength of the storm declined it stalled for an extended period over western counties of North and South Carolina, causing very high levels of precipitation. Most of the loss of life and economic damage caused by the hurricane occurred in North Carolina. The most widely reported effect of the storm was severe flooding around Asheville, a historic town near to the Blue Ridge Mountains that is a well-known tourist centre. The City of Asheville reported record amounts of rainfall - 213 mm in a 24-hour period and 251 mm over a 48-hour period.
The climate emergency view of this event is that Hurricane Helene was made worse by climate change – higher wind speeds and more rainfall. It is the sustained rainfall component of that claim that is crucial because most of the economic damage was caused by flooding. For example, in its post-disaster assessment, the State Government of North Carolina claimed that (a) the flooding was a 1 in 1,000-year event, (b) prevention measures would save $6 per $1 spent, and (c) adopting national building code standards would save $11 per $1 spent.[1]
The claim of a 1 in 1,000-year event is just political nonsense. There is no reliable way of assessing the probability because it would require a very long run of data – a minimum of 200 or 300 years – with no significant changes in land use and river management. Something as apparently simple as logging in the Black Mountains region in western North Carolina (part of the Blue Ridge Mountains which run from Pennsylvania to Georgia) would change run-off times and thus the risk of flooding in Asheville. The state was simply waving large numbers in an attempt to shift blame for what happened.
It is possible to carry out a more limited analysis that focuses on the cumulative rainfall over 24 or 48 hours. The 24-hour rainfall for Asheville may seem a lot but North Carolina is not unused to hurricanes accompanied by sustained heavy rainfall. Within the last 10 years two other hurricanes caused major damage in North Carolina - Florence in September 2018 and Matthew in October 2016. It is reported that rainfall from Florence was 777 mm in Swansboro, in the South-East of the state, more than three times the amount reported for Asheville.
We must be careful about attaching too much significance to reported rainfall records, as they are not as informative as the media think. Both weather and rainfall gauges are randomly located, so it may be a matter of pure chance whether the heaviest rainfall from a hurricane falls in a location where there is a properly calibrated and monitored rain gauge. Even so, it is obvious that very high precipitation events caused by hurricanes or tropical storms are not especially unusual in North Carolina.
I have used a different source of data to assess just how unusual the rainfall associated with Helene was. The analysis relies on reanalysis data on total precipitation from the European Center for Medium-Term Weather Forecasting (ECMWF) by 0.25° latitude/longitude grid squares. For the western part of North Carolina, the grid squares are centred from 35°N to 36°N and from 82°W to 83.5°W – i.e. 35 grid squares covering an approximate area of 21,800 sq.km. or 8,500 sq.miles.[2] The ECMWF data is recorded in metres per hour from 1 January 1940 to 31 May 2025.
After converting the data to millimetres, I calculate cumulative sums for the 24-hour and 48-hour levels of precipitation ending in each hour for each grid square. The dataset is then used to calculate the distributions of the maximum values of 24-hour and 48-hour precipitation for each year from 1940 to 2024. This is the standard data used to estimate return periods – e.g. 1 in 10 years or 1 in 100 years – which are used to report the severity of extreme rainfall events as well as many other extreme weather events.[3]
Initially, consider the grid square (centred on 35.5°N, 82.5°W) which covers Asheville. For this grid square, Helene caused much the highest levels of 24-hour and 48-hour rainfall in the last 85 years. The previous highest levels were in October 1990 and were about three-quarters of the September 2024 levels. There were also major rainfall events in August 1949, September 1977, and September 2004, but in each case these lasted for little more than 24 hours.
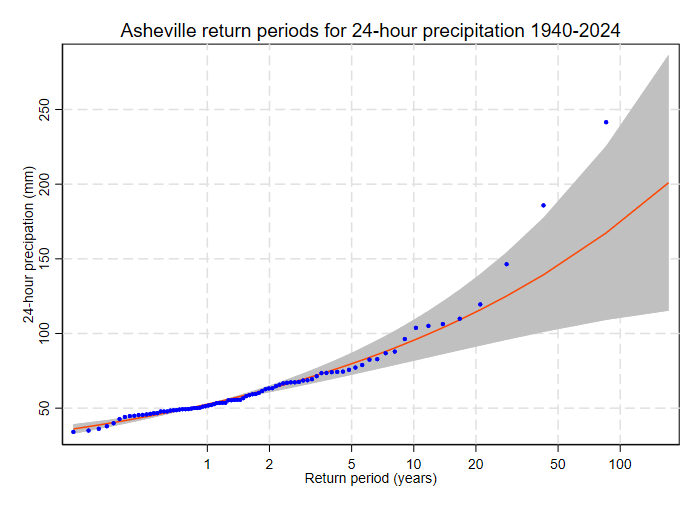
The figure above shows the results of using standard methods to estimate return periods for 24-hour precipitation.[4] The red line shows the fitted equation, the grey area indicates the 95% confidence intervals of the estimates, and the blue dots are individual events. There are two points that are important.
First, the fitted curve is pretty good up to a return period of 20 years but its predictions for infrequent major storms are too low. The claim that climate change has increased rainfall for infrequent storms can be tested statistically. It implies that the shape parameter of the distribution has increased over time; that hypothesis is clearly rejected by the data for Asheville. Still, to get reasonable forecasts of rainfall levels for events with return levels of more than 20 years it is necessary to constrain the shape parameter to a value significantly higher than the estimate obtained by following standard statistical practice.
Second, the fitted curve is estimated using the data for 1940 to 2024. What would have been the result if we had carried out the same exercise in 2023 or early 2024 using the data available that point? The extreme value on the right of the graph would be dropped and the slope of the curve would have been less steep, implying lower rainfall levels for 1 in 50 or 1 in 100-year events. In 2023 the 95% confidence interval for 24-hour precipitation for a 1 in 100-year event would have been from 120 to 228 mm with a central estimate of 155 mm. Adding the data for 2024 would have changed that confidence interval to 133 to 273 mm with a central estimate of 170 mm. On the other hand, the changes in the confidence intervals for 1 in 20-year events are much smaller.
The crucial conclusion is that even with 80+ years of data it is very difficult to make useful estimates of return levels for extreme weather events using conventional methods. Anyone who claims that they have reliable estimates of 24-hour or 48-hour rainfall levels for 1 in 100-year or even 1 in 50-year events is deluding themselves and their audience. Levels of uncertainty about weather variability are much greater than almost anyone appreciates.
A corollary is that assertions about how much “worse” specific weather events were due to climate change are pure fiction. Those making such claims have no idea of what the real – as opposed to invented or modelled (which is the same thing) – distributions of weather outcomes of individual locations are. Comparing one set of invented outcomes with another set tells us little or nothing about the amount of rain that has fallen over Asheville or any other location in western North Carolina.
Such limits on any assessment of the risks of extreme weather events complicates the task of adapting to climate change. While climate advocacy relies heavily on extreme weather events, any attempt to understand and quantify the “true” uncertainty of weather outcomes can easily be characterised as “climate denial”. It is impossible to formulate sensible policies if pointing out that what happened in Asheville in 2024 might simply be a 1 in 100-year rainfall event leads to accusations of betraying the case for stricter controls on CO2 emissions.
The rainfall in Asheville from Hurricane Helene was clearly an extreme event, but it is worth asking just how much of an outlier it was. If we accept that there is a substantial random element to the location where the worst rainfall from a stalled hurricane occurs, the logical approach is to examine the highest 24-hour or 48-hour precipitation in each year over all grid squares in the western part of North Carolina. The figure below shows the distribution of estimated return periods for the highest level of 24-hour rainfall in all of western North Carolina for each year from 1940 to 2024.
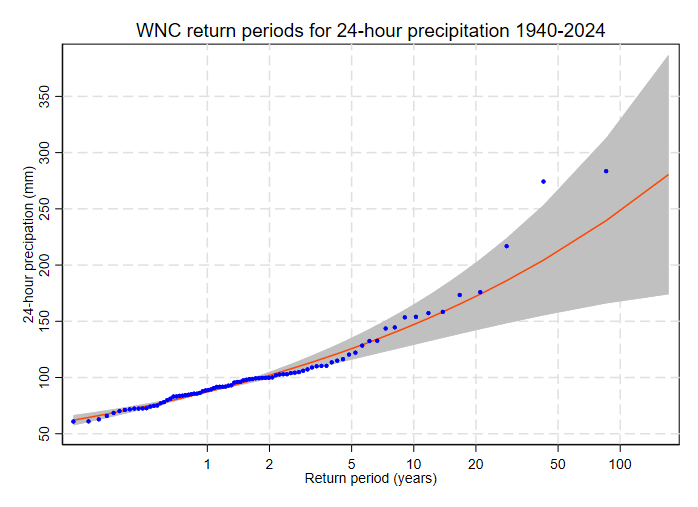
Focusing on the region rather than a single grid square, the levels of 24-hour and 48-hour rainfall in 2024 were the worst since 1940. The worst affected grid square was not Asheville, but one to the South-East of Asheville, covering Polk County, NC and the border between North Carolina and South Carolina. Further, the 24-hour rainfall total was only slightly higher than the equivalent rainfall for a similar weather event in 1949 in the grid square covering Macon County, NC as well as the borders with both Georgia and South Carolina. The border between North Carolina and South Carolina was also the location of the second worst 48-hour rainfall event in 1990 due to the combined effects of Hurricane Klaus and Tropical Storm Marco.
Records for the economic damage caused by hurricanes are very patchy, so assertions about economic impacts must be treated very carefully. However, there is a very striking difference between reports of Hurricane Helene, which was claimed to cause damage of at least $61 billion in North and South Carolina, and Hurricane Klaus plus Tropical Storm Marco. The latter’s damage in the same two states was reported as less than $0.2 billion at 2024 prices. Similarly, the reported numbers of deaths in the two states are an order of magnitude different – 160 for Helene, 12 for Marco.
The asymmetry between the two states in the economic damage claimed for Helene is also rather odd: nearly $60 billion for North Carolina, less than $2 billion for South Carolina. This was despite 24-hour and 48-hour rainfall being heaviest in grid squares spanning the state border. The total population of the Asheville metropolitan area in North Carolina plus neighbouring affected counties is about 500,000, whereas the combined population of Greenville and Spartanburg counties on the South Carolina side of the border is about 940,000.
While this may have been bad luck, it seems equally plausible that the state and the municipal authorities around Asheville had simply failed to invest in adequate flood defences. The state’s claim that what happened was a 1 in 1,000-year flood gives little confidence in its competence at risk assessment. The rainfall associated with Hurricane Helene was high, but it was only slightly higher than the rainfall for previous events in 1949 and 1990 in nearby parts of the state. In addition, higher rainfall levels caused by stalled hurricanes have been recorded elsewhere in both North Carolina and South Carolina.
What are the lessons that should be learned? After Hurricane Andrew caused such extreme damage to buildings when it hit southern Florida in 1992, there was a concerted effort to upgrade Florida’s building codes for new buildings and to improve existing buildings to comply with the same standards. Similar efforts were made in Japan following the Kobe (or Great Hanshin) earthquake in 1995 to upgrade the building standards for infrastructure as well as housing and commercial buildings.
An equivalent effort is required in North Carolina to upgrade both infrastructure and flood defences to cope with the flooding caused by extreme rainfall events. The starting point should be better assessments of weather variability based on regional data, as outlined here, rather than individual locations. It is usual in developed countries to adopt standards that will protect against 1 in 100-year storms. Is that sufficient, given that the costs of extreme weather events tend to rise sharply with the return period? For several decades the Netherlands has applied standards based on coping with at least 1 in 1,000-year floods, but the country has records and folk memories that go back more than 300 years.[5]
However, risk assessments and associated standards are of little value if sufficient money isn’t allocated to, say, flood prevention and spent on projects that are effective and implemented in a timely manner. Why did the state and the city of Asheville not learn from the rainfall events that occurred in 1990 due to Tropical Storm Marco? Was there a sense that what happened less than 50 miles away could not happen here? If so, this was a classic case of hubris.
The obsession with climate change complicates everything. Bureaucracies and activists are bad at dealing with more than one issue at a time. There is a very widespread sense that if only climate change were mitigated, then all problems of weather variability would go away. Of course, that is patent nonsense, but how often do either environmental or meteorological agencies acknowledge the great uncertainties about weather variability when discussing floods, wild-fires, and other weather-related natural disasters today?
The starting point in thinking about such events should be to ask: what does this tell us about the variability of weather outcomes? Only if such outcomes lie outside the reasonable range of such outcomes based on proper datasets that cover long time periods should we draw any inferences about climate change rather than revising our models of weather variability. That is the lesson we should draw from what happened in North Carolina last year.
To reinforce that we should move away from a focus on the most extreme weather events. The second worst rainfall event recorded for North Carolina was the consequence of a “mere” tropical storm, which was reported as causing limited economic damage. The focus on the most extreme hurricanes distorts a detailed understanding of the potential consequences of weather variability.
In the light of what happened in Asheville, how might an analyst react when told that there is a climate emergency that might increase the probability of wildfires, floods and other consequences of extreme weather events? To my mind, it is unquestionable that the priority would be to ask what measures can be taken to reduce the damage that might be caused by such events – i.e. clear the fuel required for wildfires, improve flood defences, upgrade vulnerable buildings to provide greater wind resistance, etc. In common parlance, these are no-brainers. They are also climate adaptation in practice.
Suppose we take this one step further and assume that the state of North Carolina is willing to allocate a budget of $1 billion per year to address the “climate emergency”. How should it spend this money? Either (a) on mitigation of climate change that may, perhaps, reduce the probability of severe hurricane damage in 2050 or 2060, or (b) on flood prevention and other measures that will certainly reduce the damage caused by multiple hurricanes that, based on recent history, will certainly hit the state in the next two decades.
This is where the whole rhetoric of a climate emergency is bizarre. Almost all activists would give priority to (a), and many would actively oppose the practical measures that are implied by (b). The logic is that slowing climate change is a distant and Platonic goal, while adaptation to ameliorate the effects of normal weather variability – or, perhaps, the impacts of climate change - involves more concrete choices that may require unpalatable compromises.
None of this should be construed as downplaying the devastation and losses suffered by those who were directly affected by the flooding that occurred due to Hurricane Helene. However, the task of ensuring that such losses do occur again in future must be based on a realistic assessment of risks and how they should be managed. The state and local authorities appear to have failed to learn lessons from previous extreme rainfall events in the region and to act upon them. That should not happen in the aftermath of the Asheville floods.
[1] See Hurricane Helene Recovery (North Carolina Office of State Budget and Management). Referring to a disaster as a 1 in 1,000-year event means that there was a probability of 0.001 or 0.1% of it happening in any year.
[2] Since the grid squares are centred at latitudes 35, 35.25, 35.5, 35.75, 36 the South-North distance is from 34.875°N to 36.125°N and similarly for East-West.
[3] Return periods or recurrence intervals are a way of discussing the probability that an event of at least some magnitude – i.e. 24-hour precipitation of 200 mm or greater – will occur. A return period of 1 in 100 years means that the probability of that event is 0.01 or 1% in any year. Be careful, it does not mean that such an event will only occur once in 100 years, since the model assumes independence in what happens each year.
[4] The data analysis has been carried out in Stata using David Roodman’s extreme module. This permits the calculation of confidence intervals for the return level for a specified return period and the reverse calculation. The estimates reported are based on estimates of generalised extreme value (GEV) distributions for block maxima using small sample corrections.
[5] Nominally, the standards are based on a 10,000-year return period but most recognise that such long return periods are probably meaningless and were based on outdated or misleading methods.
“While extreme weather events are, by definition, infrequent occurrences in particular locations, they are routine when we examine them in a wider context and over long periods of time”. Clive Best did a calculation over a decade ago to show the absolute certainty of experiencing an extreme weather event (hottest, coldest, wettest, driest) somewhere or other each year: https://clivebest.com/blog/?p=6252.
Most people are sick and tired of having every spell of bad (or warm) weather unscientifically hyped as supposed “proof” of impending Thermageddon. Climate propagandists use the pseudo-science of “attribution” based on modelling to generate headlines such as “Climate change made US and Mexico heatwave 35 times more likely”: https://www.bbc.co.uk/news/articles/czvvqdg8zxno.
I find it amusing that climate alarmists seem to have their extreme weather fearmongering due to global warming the wrong way round, as extreme weather in our latitudes was much worse during the Little Ice Age than now, as recorded in this Paul Homewood post (one of many): https://notalotofpeopleknowthat.wordpress.com/2022/05/08/extreme-weather-during-the-maunder-minimum/.
I understand that the increased temperature differential between the colder northern latitudes and the warmer tropics caused more intense storms. ChatGPT concurs. If so, global warming should give us fewer such events.
Way back when, at my bachelors and masters program at university in hydraulic engineering, the method for extrapolating available data to longer "return" periods was to use Gumbell Distribution. We didn't have computer programs then to do the analysis, but we had the data and we had "Gumbell Distribution" graphing paper. Available streamflow data always plotted on a "pretty good" straight line, so with professional and prudent confidence an engineer could extrapolate out to longer return periods as a basis of design for flood control mitigations.
That technique seems to have been forgotten. I had the opportunity to speak with Met Office people at a university reception. Recurring floods were in the news and of course both the media and the Met Office people blamed "climate change"--whatever that is. I asked them about forecasting and setting flood control designs based on Gumbell Distribution and nobody knew a thing about it. I asked around to other academics at this reception. They all said "Impossible to forecast extreme events due to Climate Change.", they said.
Nonsense.
P.S. In the late 1970's plotting North Sea wave heights on Gumbell Distribution came up as straight lines, so for early offshore structures setting the extreme wave height for longer return periods was done that way. I don't know what they do now--probably a universal standard.