A solar feeding frenzy

On a sunny spring day thoughts turn lightly to … solar power. This is a somewhat distorted version of the famous line from Lord Tennyson’s poem “Locksley Hall”. The poem rails at social lies [“Cursed be the social lies that warp us from the living truth!”] as well as choices made solely for monetary reasons [“Cursed be the gold that gilds the straiten’d forehead of the fool!”].
My wife is the literary critic and poet in our family. Still, even I – a mere number cruncher – can identify with the feelings expressed by Lord Tennyson when dealing with the absurdities that are prompted by a social lie (Net Zero) backed up by enormous quantities of gold.
The context for these thoughts is that since writing my post on the economics of solar power I have been contacted by several groups who face the prospect of large solar developments that are intrusive, badly designed and often make little economic sense. I will draw on a specific example – Springfield Solar Farm, which is being developed by a large solar operator called Voltalia. Its site is near to Innerwick in East Lothian. The project includes up to 165 MWp of peak solar capacity and a battery storage facility of up to 150 MW.[1]
My initial reaction to the proposal was to ask whether the developer was daft. While East Lothian is known as having a mild climate (by Scottish standards), the site latitude is nearly 56°N with all that means for solar radiation and the angle of the sun during much of the year. This can be checked by using the PVWatts calculator - the best non-commercial solar resource calculator that is maintained by the US National Renewable Energy Laboratory.
For Innerwick, PVWatts reports a net yield of 691 kWh per kWp of peak capacity per year for a tilt of 25 degrees after allowing for inverter and other system losses. As a comparison, the equivalent net yield for a site near Swanage, Dorset on the south coast of England is 970 kWh per year, i.e. 40% higher than the yield in East Lothian.
Two international comparisons illustrate how poor the solar resources in Scotland are: (a) our village of Civenna above Lake Como in Italy (surrounded by mountains at a latitude of 46°N) has an annual net yield of 1,174 kWh, and (b) Falmouth on Cape Cod in Massachusetts (at a latitude of 41.6°N) has an annual net yield of 1,429 kWh.
These examples illustrate a separate point. This is the terrible quality of the advice offered to non-specialists by those selling solar installations. If you check online for the optimal fixed (year-round) tilt of solar panels in the UK, Google’s AI will tell you 35 to 40 degrees reflecting the consensus of advice from installers. However, detailed estimates show that the optimal fixed tilt in Great Britain is about 25 degrees from Scotland to the South Coast.[2] In contrast, it is 30 degrees in Civenna and 32 degrees in Falmouth, Mass.
The reason behind these differences is not hard to work out. At latitudes of 50°N or greater the only thing that really matters is to maximize the yield from April to September. Those six months account for 82% of the optimal annual yield. Since electricity market prices tend to be lower than their annual average during the summer months, the inverse correlation between monthly yields and market prices reduces expected revenue for a solar farm in Scotland by 6-7%.
These simple back-of-the-envelope calculations prompt two broader questions. First, what is the distribution of solar resources over Great Britain as a whole? Clearly, the best locations are in the south of England, but what is the penalty for sites in the north of England or Scotland? Second, on what financial basis would it be worth investing in a large solar farm in Scotland or other parts of Great Britain? In economic terms this can be treated as asking: how does the locational payment per MW of capacity (including land rent) that solar farms can afford to pay vary by location?
I address the first question by using data by lat/lon grid square on solar irradiance for the 25 years from 2000 to 2024. The data was extracted from the ERA5 weather database maintained by the European Centre for Medium-Term Weather Forecasting (ECMWF). The grid squares are 0.25 x 0.25 degrees and the ERA5 database is constructed from a reanalysis of satellite weather data. The solar irradiance data consists of hourly measurements of two variables: (a) surface net solar radiation in Joules per square meter per hour, and (b) surface solar radiation downwards in Joules per square meter per hour. Both are converted to Watts per square meter per hour and when aggregated over a month they are expressed as kWh. The results are very similar for the two measurements. Hence, I will focus on solar radiation downwards, i.e. direct exposure to solar radiation, as it is less affected by local factors that might scatter or reflect solar radiation.
To obtain estimates of net yield, I have used PVWatts to obtain estimates of net monthly yields for a sample of locations at latitudes from 50.0°N to 57.75°N and longitudes, as far as possible, in the range from 2.0°W to 3.0°W.[3] This sample was used to calibrate monthly regression equations that predict monthly net yields from monthly solar radiation for each grid square. A land-sea mask was used to exclude grid squares for which land coverage is less than 1% (roughly 4 sq. km).
The predicted net yield for the grid square that covers the Springfield Solar Farm located is 715 kWh per year, a bit higher than the 691 kWh per year for the solar farm itself.
The graph below shows the distributions of net annual yields by latitude together with the line fitted to these points. The fitted line is calculated using weights for each observation equal to the proportion of each grid square covered by land. Many of the grid squares with the highest net yields for each latitude cover coastal areas.
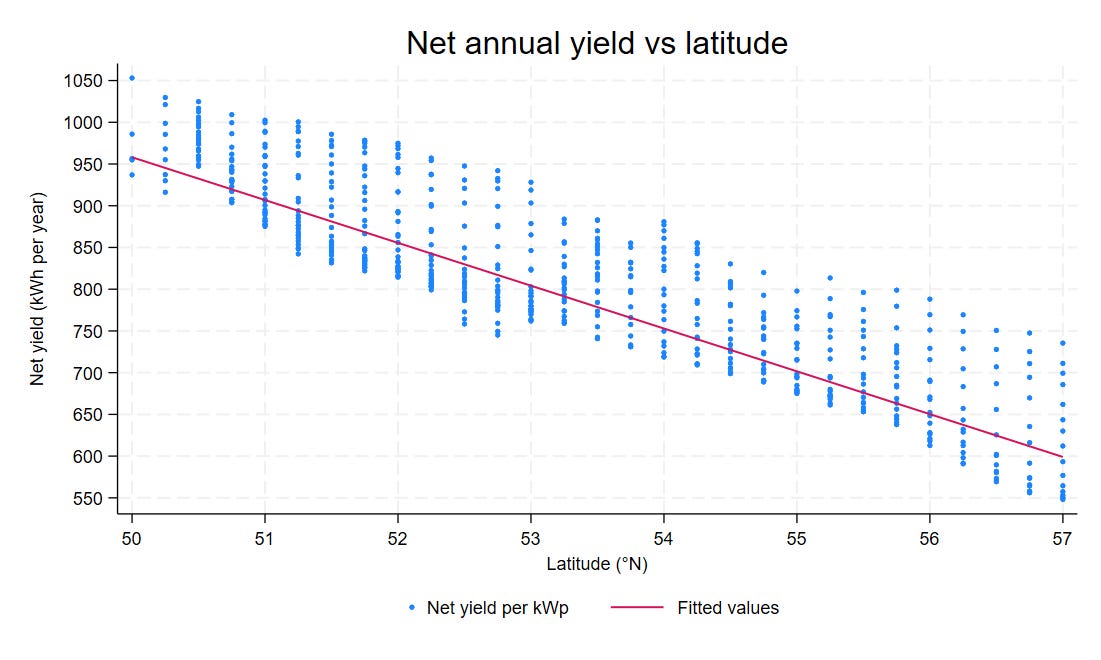
The fitted line indicates that the expected value of annual net yield from solar panels will decrease by about 50 kWh per kWp of peak capacity for each degree of latitude north of 50°N. At an average price of about £72 per MWh in 2024 that translates to £3,600 per year per MWp. For a solar farm with a capacity of 100 MWp that is a difference in gross revenue of £1.8 million per year between locations in Somerset, Hampshire or Sussex at a latitude of 51°N or in the Lothians at a latitude of 56°N.
To provide context, £1.8 million per year for a solar plant of 100 MWp is roughly double the annual Transmission Network Use of Service (TNUoS) charge for a solar plant located in National Grid’s Somerset and Wessex Zone. However, it is similar in magnitude to the 2024-25 TNUoS charge for a solar plant located in the Lothian and Borders Zone. By choosing a location in Scotland Springfield Solar Farm is not only sacrificing output and, thus, generation revenue, but it will pay a much higher annual TNUoS charge because grid capacity is heavily congested in Scotland.
This brings me on to the Alice in Wonderland world of solar economics in the UK. In recent CfD auctions the strike prices for solar projects (all at 2024 prices) have gone from £64 per MWh for AR4 to £66 per MWh for AR5 to £70 per MWh for AR6. At £70 per MWh a new solar project will only cover a real pre-tax cost of capital of 0% if we assume that average capex and opex costs are one-half of what the evidence from company accounts examined in my solar study suggest are reasonable.[4]
In this fictional world a solar farm with a net yield of 926 kWh per kWp – the average net yield for plants located at 51°N – can afford a total locational payment of about £16,000 per MWp. This amount would have to cover rent, business rates and TNUoS charges. Solar plants benefit from a general exemption from business rates for plant and machinery used for renewable energy generation and storage, but business rates are still payable on land rents and infrastructure assets such as roads and buildings.[5] The standard rating formula in England since 2023 is to set a rateable value of £8,250 per MWp. For large solar farm the effective tax rate is 54.6% in 2024-25, which translates to an annual bill of about £4,500 per MWp for business rates.
Such a payment would permit a rent payment of £2,400 per MWp per year in real terms. This is consistent with indicative figures of a base rent of £800- £1,000 per acre adjusted for inflation and 2-3 acres per MWp of capacity. A turnover or royalty rent of 5% of gross revenue would be significantly higher but may be less attractive to landowners both because of the risks and potential exclusions from eligible gross revenue.
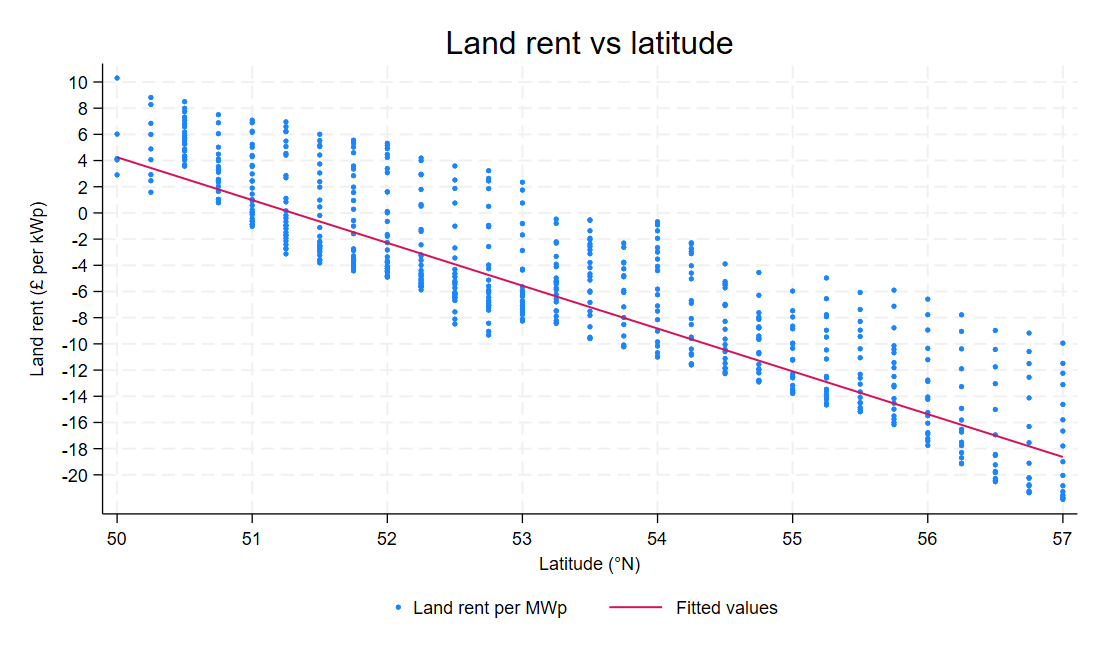
The figure above translates the net yields in the previous figure to land rents per kWp. In all cases I have assumed that the TNUoS charge is £9.10 per kWp and business rates are £4.5 per kWp. There is large variation in the land rents that can be afforded at different grid squares for any specific latitude, but there are no grid squares for which a positive land rent can be afforded if the latitude exceeds 53°N, i.e. north of Stoke-on-Trent, Derby and Nottingham.
Few landowners would be willing to accept a land rent that is significantly less than £2.0 per kWp because of the length of the commitment required – up to 40 years. On this basis, potential locations for developing solar farms are concentrated in three areas: (a) East Anglia and South-East – longitudes east of the Greenwich meridian and latitudes from 51°N to 53°N; (b) the South-West and South Wales – longitudes west of 3°W; and (c) the South of England – latitudes south of 51°N.
These areas account for less than 10% of the land area of Great Britain and include a large portion of the richest communities in the UK. Many of these communities attach a high value to preserving the landscape and other features of their local areas. In addition, agricultural values tend to be high, setting a higher base for the land rents that must be paid. Thus, it is hardly surprising that there are often strong objections to the development of solar farms as well as relatively high costs of both construction and operation.
To return to my original observation. It is, indeed, daft to contemplate developing solar farms in locations such as East Lothian and further north in Scotland at the CfD strike prices that were set in the last three allocation rounds – AR4 to AR6. Why such proposals are pursued is a mystery. None of the data and analysis presented above is difficult to obtain and understand.
Even on assumptions that are either extremely optimistic (based on actual evidence rather than fantasy forecasts) or inconsistent with current economic conditions, developing solar plants in locations north of 53°N makes no sense. Maybe developers believe that future offtake prices will be considerably higher than current CfD prices. Alternatively, there may be some other secret sauce that means such projects might be viable. That might be an expectation that the current government will be so desperate to meet its Net Zero targets that it will abandon any semblance of fiscal discipline to ensure that new projects have the incentives to go ahead. Of course, such a belief bodes ill for those who will have to pick up the bills!
Hence, my reference to a solar feeding frenzy in the title of this piece. There is a rush to get planning consent for ever larger solar projects. These projects will almost certainly never be financially or economically viable. The goal for solar investors seems to be to create a portfolio of speculative options, a few of which might just be worth exercising in future if market or CfD prices increase substantially.
In my experience, few of the staff who work for the developers have any understanding of the game, so they take the projects seriously. That does not excuse the behaviour of investors and the senior managers of developers who feed gullible journalists and bureaucrats large amounts of green nonsense. They should be fully aware that many of their development options have little or no chance of being exercised.
The current consensus among lobbyists, journalists and policymakers in London is that it is the planning system that is to blame for low economic growth. That is codswallop. Certainly, the planning system is inefficient and arguably broken. However, that is a consequence of the overwhelming number of badly designed and unviable projects that are submitted for planning consent with little or no prospect that they will ever make financial sense.
Among other things any applicant for planning consent should be required to post a large bond - maybe 10% of the expected capital cost of the project - that would be forfeit if the planning consent is granted but project development does not commence within, say, 2 years. That would entirely change the incentives for developing and proposing viable projects. It would also require a substantially different approach to how subsidies are allocated, but that would certainly not be a bad thing.
[1] The acronyms kWp and MWp are used to refer to the peak capacity of solar panels and solar farms under standard operating conditions. Such conditions are rarely, if ever, met in the UK, so that the peak capacity of a solar farm is a notional number and has limited operational relevance. The capacity of battery storage plants is usually reported as the maximum level output that they can achieve. Their storage capacity is reported as the number of hours for which that maximum output can be sustained. Most battery storage plants in the UK can sustain their reported output capacity for no more than 2 hours.
[2] That should be a warning for anyone who believes that AI based on large language models is of any use in cases where the online consensus may be wrong.
[3] For latitudes of less than 51°N it was necessary to select locations with longitudes west of 3.5°W.
[4] The financial analysis assumes that the net yield declines at a rate of 1% per year while opex costs excluding locational payments increase at a rate of 1% per year. These parameters are below the rates of decline/increase estimated in my study of the economics of solar generation. As noted, the assumption of a real pre-tax cost of capital of 0% is absurdly low given the risks of investing in solar generation, but it is not possible to make sense of CfD bids on any other basis.
[5] The exemption from business rates for renewable plant and machinery is somewhat less significant than most sources make out. It is a general principle that rateable values (the tax base for business rates) exclude plant and machinery. Drawing the boundaries is difficult, especially for equipment that forms part of buildings such as cables and lifts, so the “exemption” is more of a clarification than a major change.
Thank you for another piece of masterful analysis. I believe I've noticed that subsidy farms are marketed to the public as generating "up to x megawatts, enough to power y thousand homes" - nothing of course to account for capacity factor.
My rooftop solar installation (panel elevation angle 30 degrees) in north Shropshire (52.8N, 3W) has operated over the past three years with a capacity factor of 10.4%, broadly in line with expectation.
As to the Lothian batteries with a capacity to supply peak power for 2 hours, is there another sleight of hand in that they are marketed to give the impression of storage when their real purpose is to proved some measure of inertia to the grid? Even in the Lothian summer, solar generation nights last longer than 2 hours.
I suppose there is an assumption amongst many who believe the net zero myth that generating power is the reason for such developments, when it appears obvious it is a classic bait and switch, I expect the wizard to be revealed by Toto at any minute.